
Track overview
Measure the change in your customer data over time
Track allows you to measure the change of your profiles, attributes, and segments over time.
You can keep track of the population of your "high lifetime value" segment, the average order value of online shoppers, or the average daily NPS for all customers. We’ll take a tour of the key concepts, explore the feature and discover how to build your own Track dashboard.
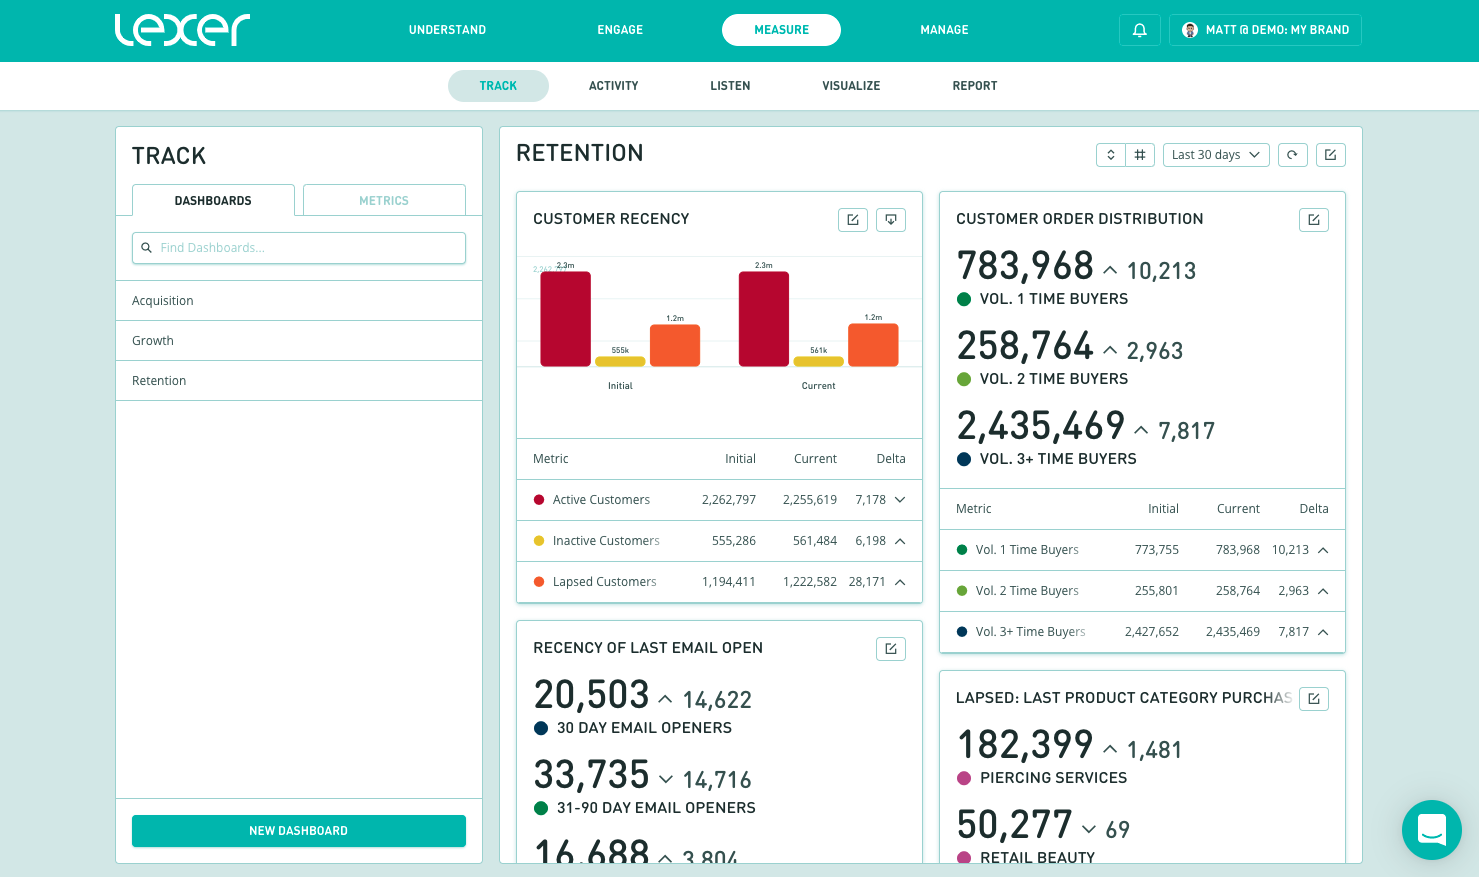
How does Track work?
Dashboards display customer data and allow you to group related metrics together for easy reference.
These are the 2 steps to setup your Track dashboards:
- Add metrics to a segment.
- Create a dashboard, then drag and drop the metrics you have added into the dashboard.
Metrics are your customer data, taking a calculation (such as the average or the sum) of an attribute (such as "total spend" or "NPS score") for a segment (such as "active customers", "online shoppers" or even "all customers"). For example, you can track “the average total spend for active customers”. Once configured, Lexer will capture the value of this metric each day.
Cards allow you to configure how metrics are visualised in your Track dashboards. Cards can have one or more metrics and a display name. You can also customise how a Card presents information, through a line graph, a bar chart or a summary number.
Access to Track is controlled by your group permissions and relies on your team using Lexer's CDP. If you don't have access to Track, and would like to, simply ask your account admin or reach out to Lexer Support.
How to track a metric
You can track metrics within Segment or Track.
These are the four types of metrics you can track:
Segment
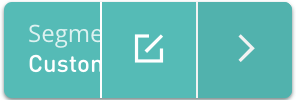
- Find the Segment "Customers" and click on the > arrow.
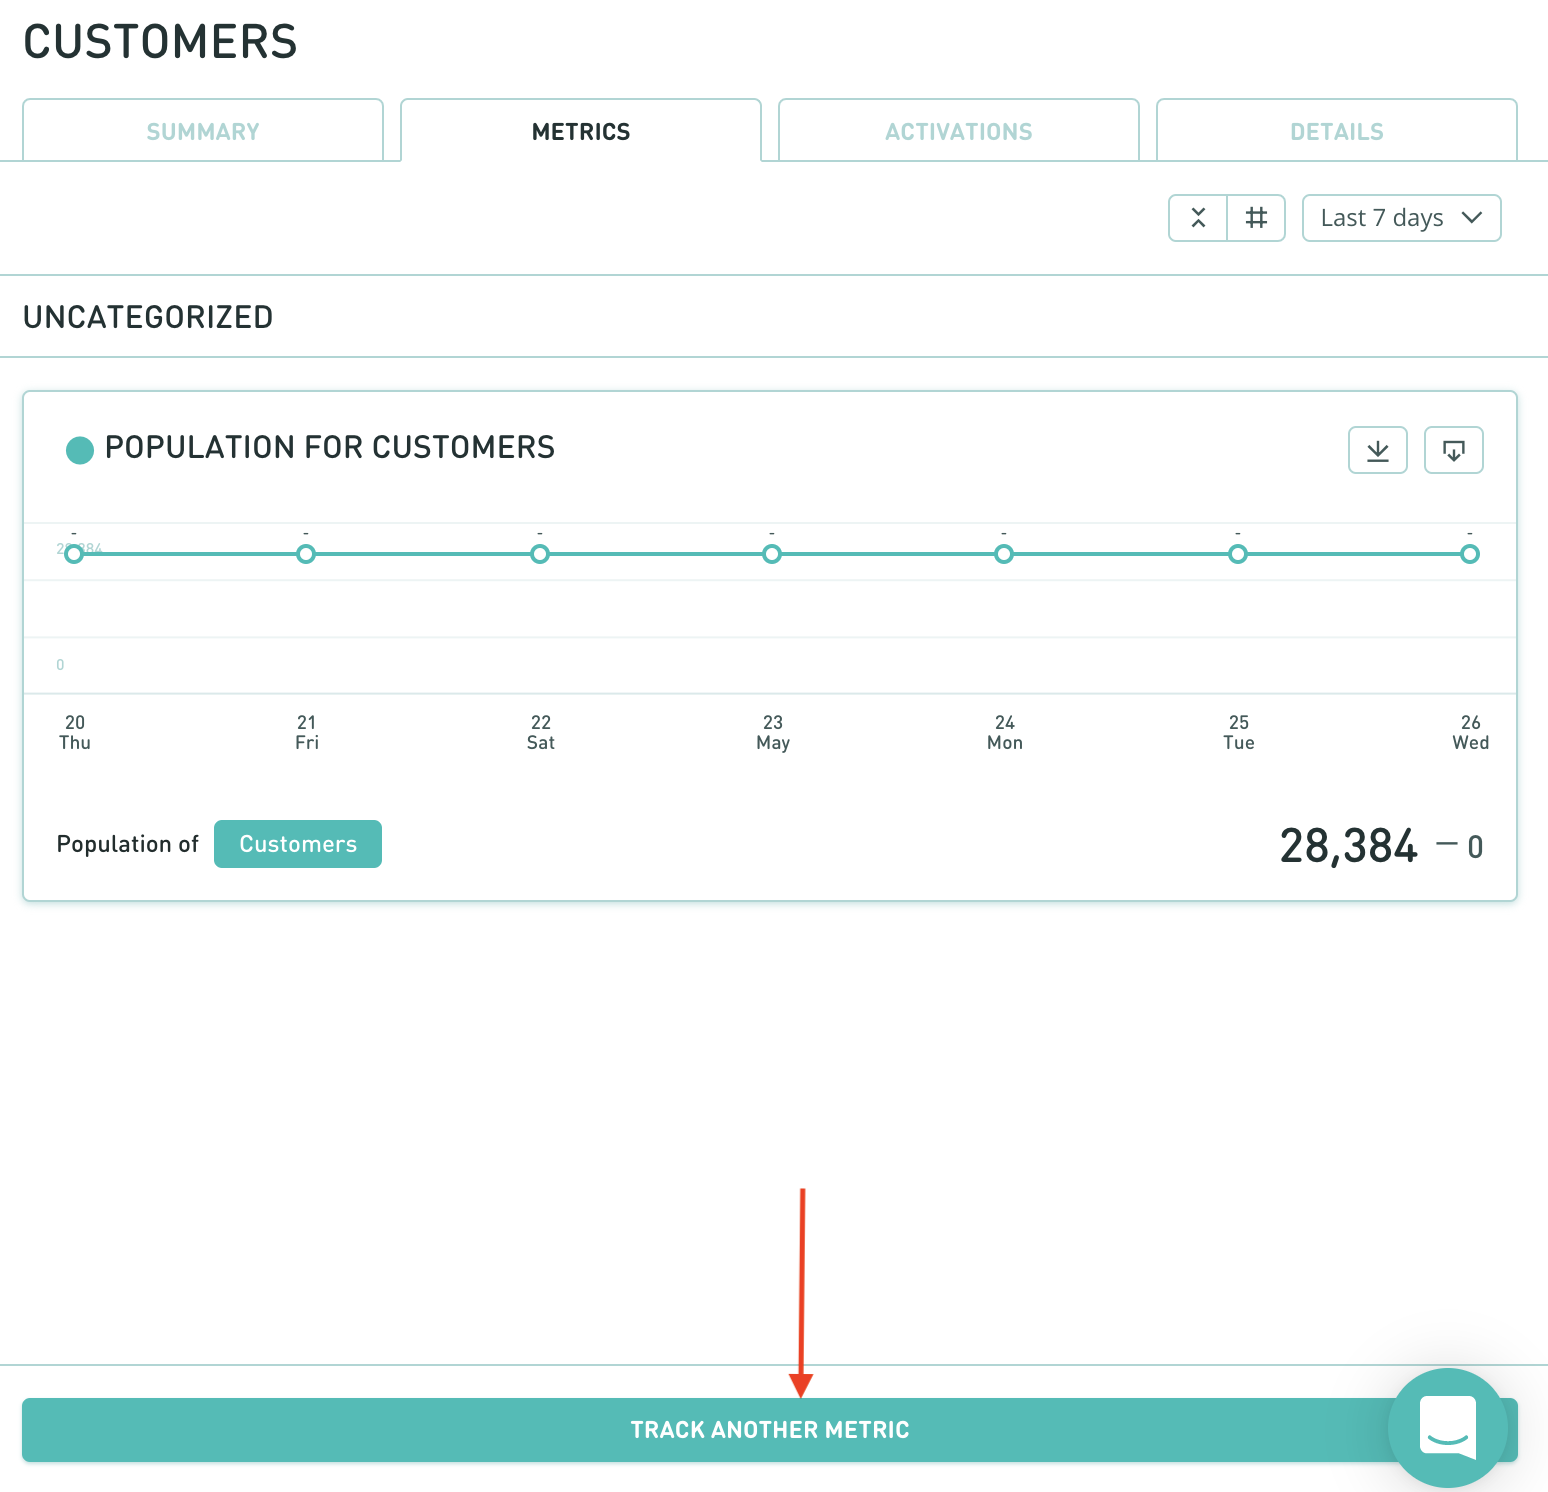
- Toggle to the Metrics tab.
- Select Track another metric.
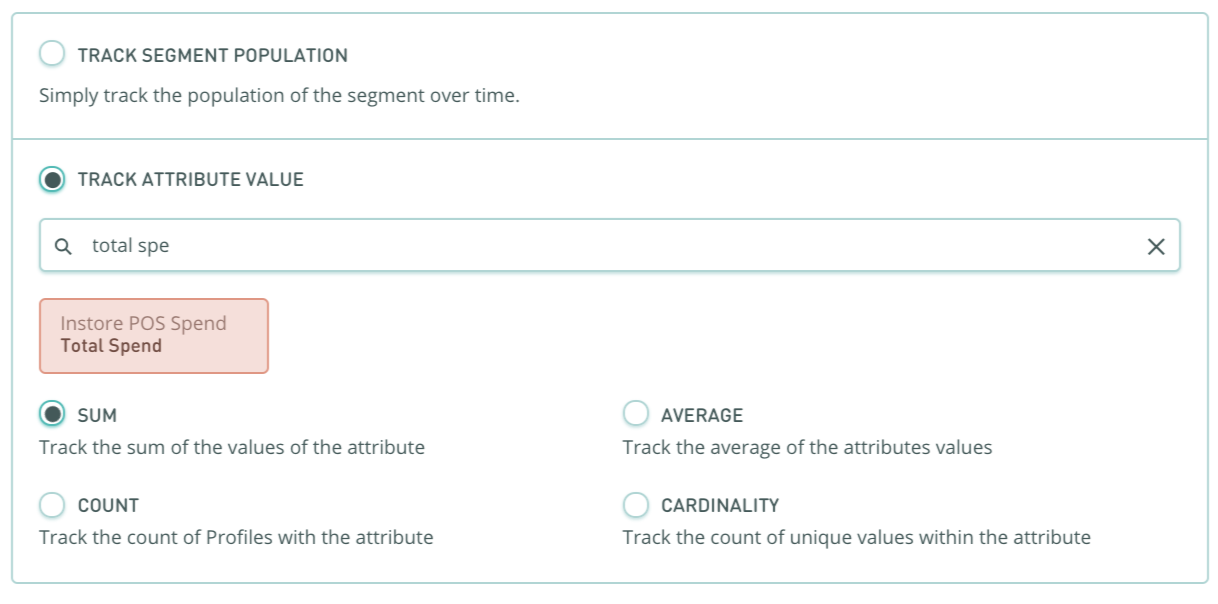
- Select Track attribute value and find the "Total Spend" attribute and select Sum.
- Provide Name, Category, Description, and Colour in the details.
- Hit Save.
Track
In Track, navigate to the Metrics tab and click Track Another Metric. You will be presented with the following menu:
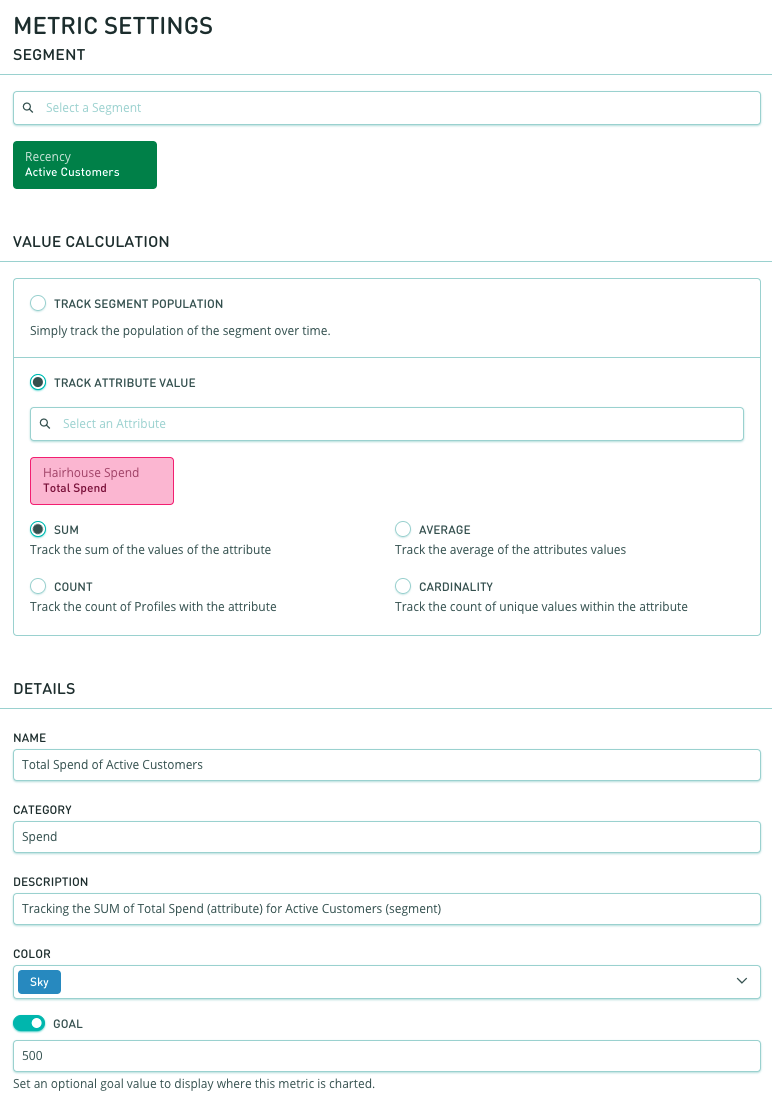
Select a Segment of customers to track this metric against.
- Either track the population or a specific attribute (i.e. Total Spend).
- Specify the calculation (Sum, Count, Average, Cardinality) which determines the value being stored each day.
- Specify details such as Name, Category, Description, and Color to keep it organized.
- Optionally, enable a Goal value, which will be displayed on line charts for this metric.
Once your metric has been created we will track the calculated value each day, allowing you to add charts to various dashboards to visualize this data. You can also open this metric in the Metrics tab to view and download the daily values for insights and reporting.
How to create a dashboard
Navigate to Measure > Track and click New Dashboard in the Dashboards tab. Specify a Name, Category, Description, Color, and select which groups should have access. Once you have a dashboard you can start adding charts to display your metrics.
Adding charts to your dashboard is easy. Simply navigate to the Metrics list, search for an attribute or metric, and drag it from the list into your dashboard. This will either create a new chart if you drag onto the open space, or add it to an existing chart if you drag on to one already created. Save your changes and the dashboard will be available for others in your team to view.
How to annotate a dashboard
Track also allows you to annotate your dashboards, which is handy for letting your team know about key business events!
You can do this in three easy steps:
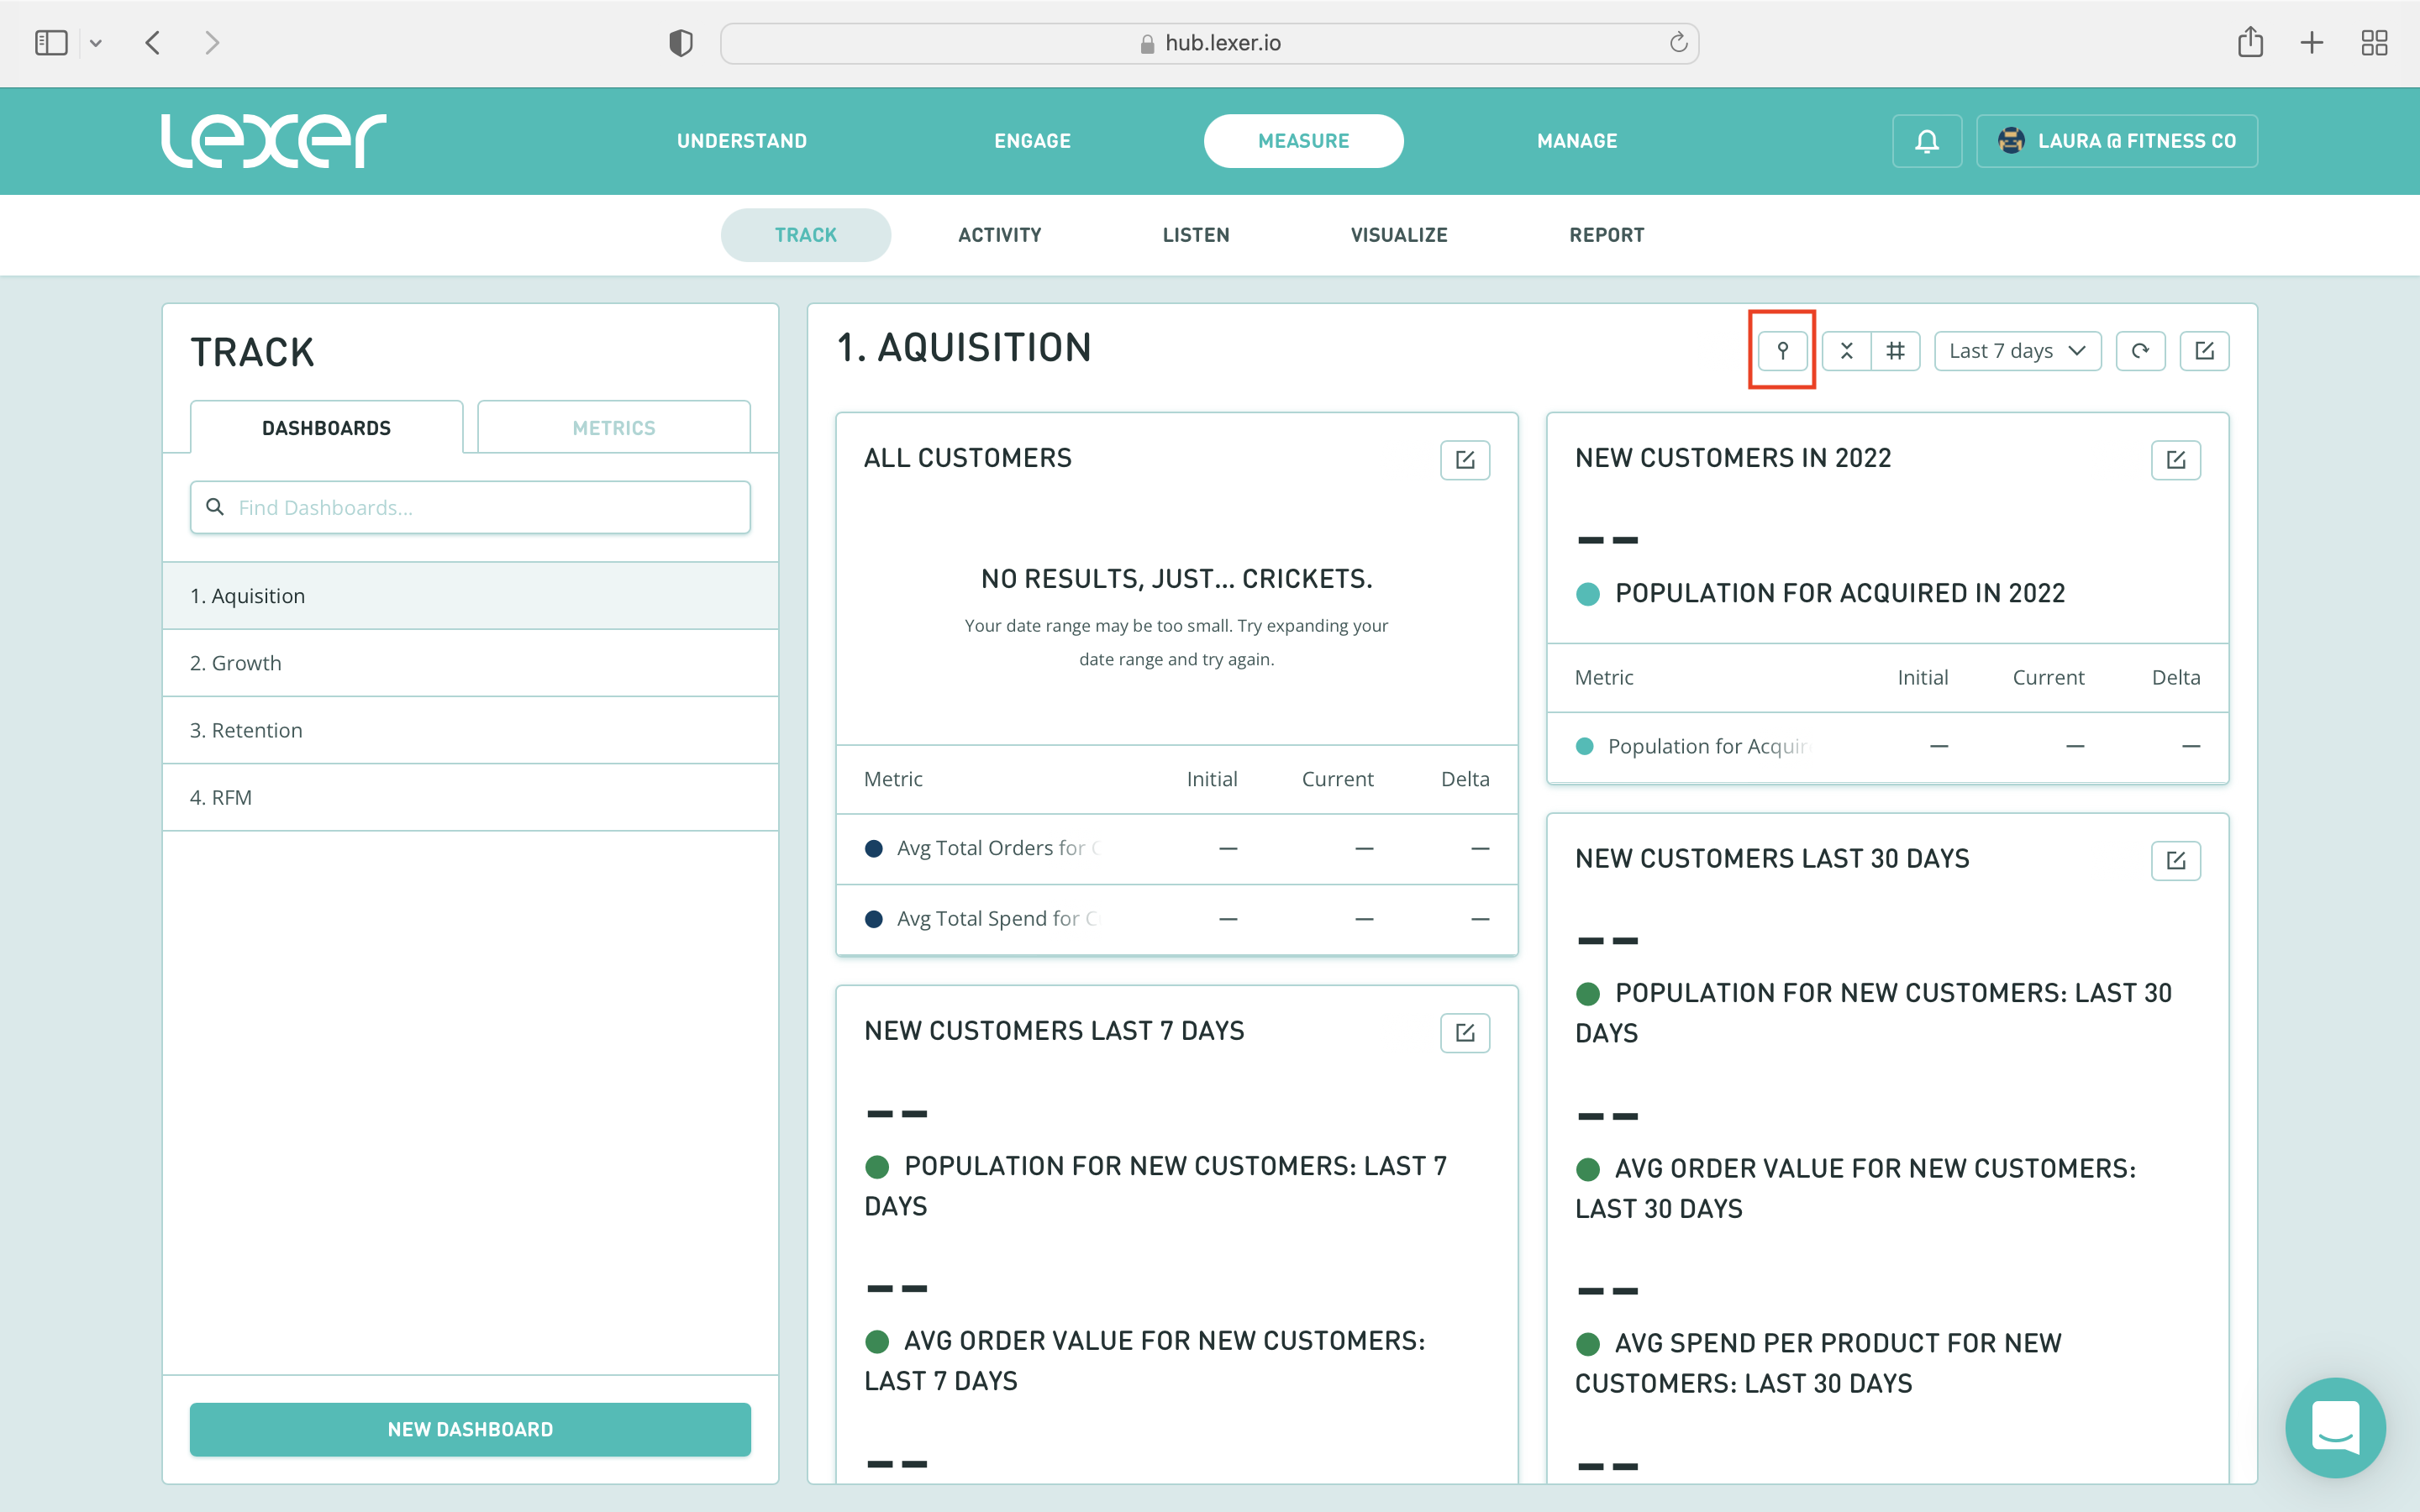
- Select the annotate icon in the tool bar at the top of your chosen dashboard
- Include the date of your annotation and write your description (or annotation).
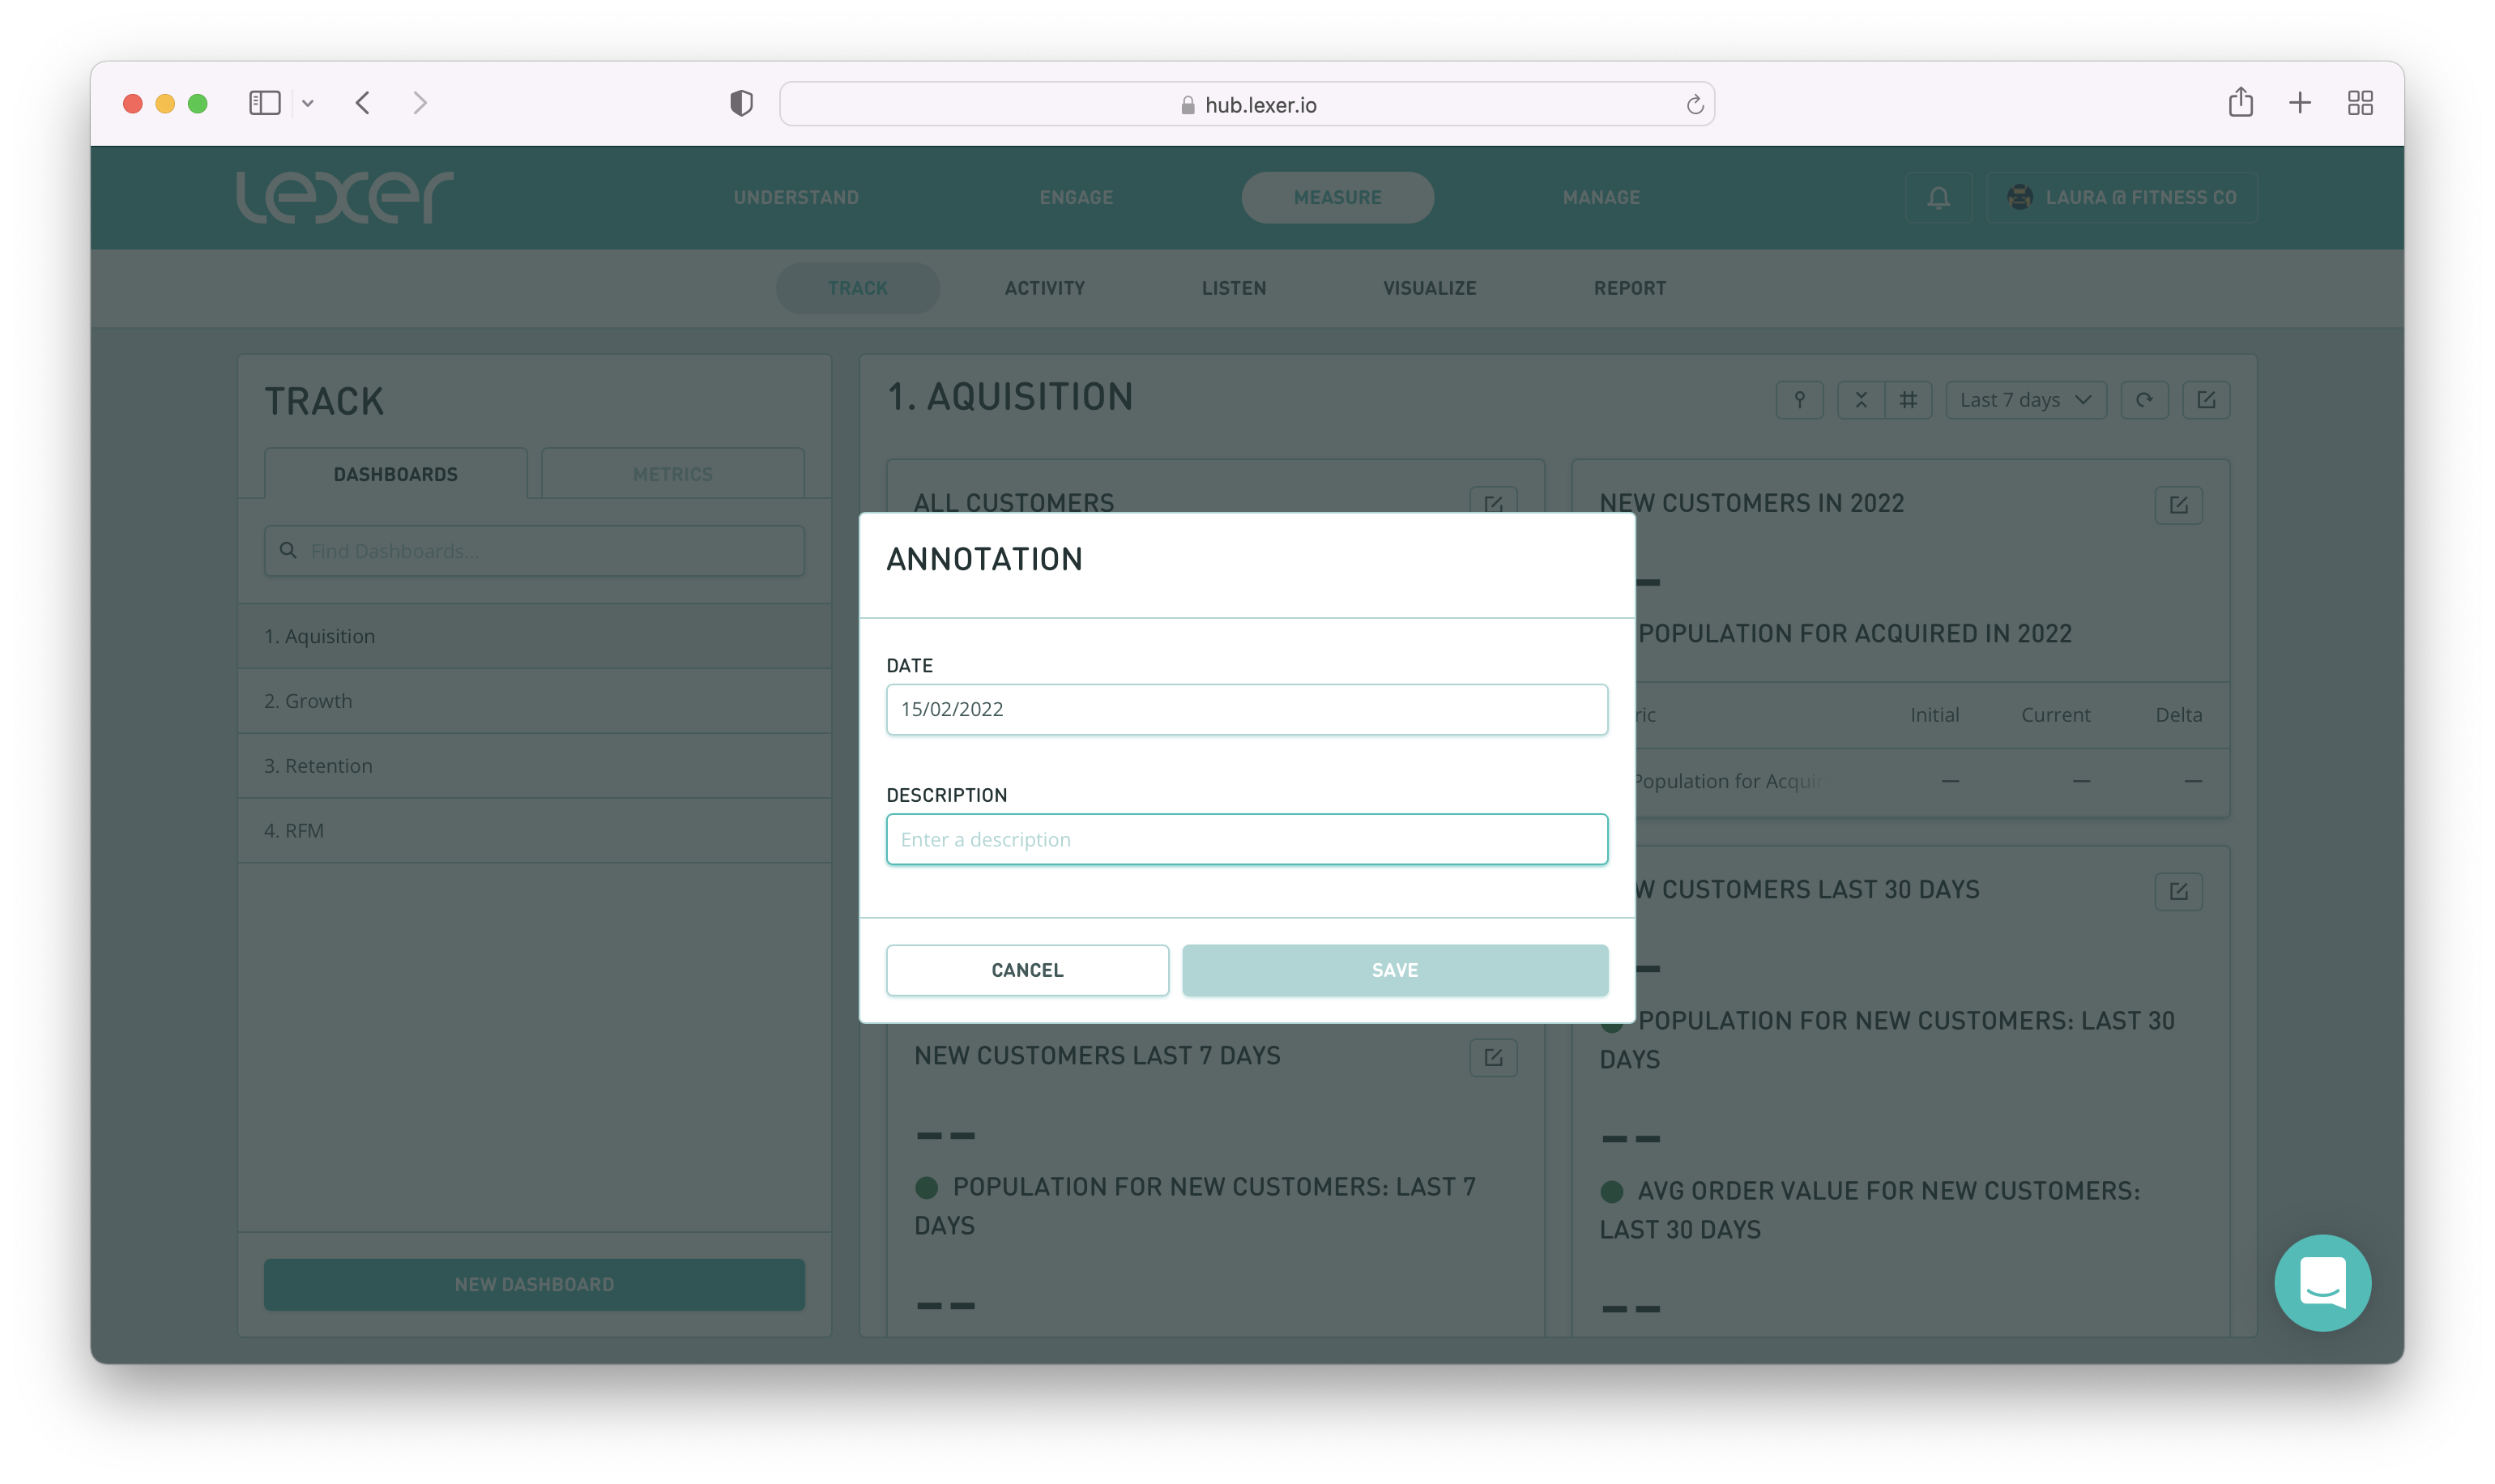
- Hit Save and your annotation will be saved and ready for your team to view.
Additional information
You can change date ranges and track how populations grow or decline. However - Track will measure from the time you set the metric.
Once you have set up a segment to track, if you then edit that segment, it will continue to track the original segment. Track currently captures a "snapshot "of the data when you track a metric.
If you do change a segment, we’d recommend setting up that new segment, and commencing the track process again to ensure you’re measuring the correct data set.
Feel free to contact Lexer Support if you would like help creating, updating or reviewing your Track dashboards. We're always here to help!
