Dashboards has two tabs that answer different questions. Here's which one to open, and how to read the comparisons so you don't mistake a timing gap for a real change.
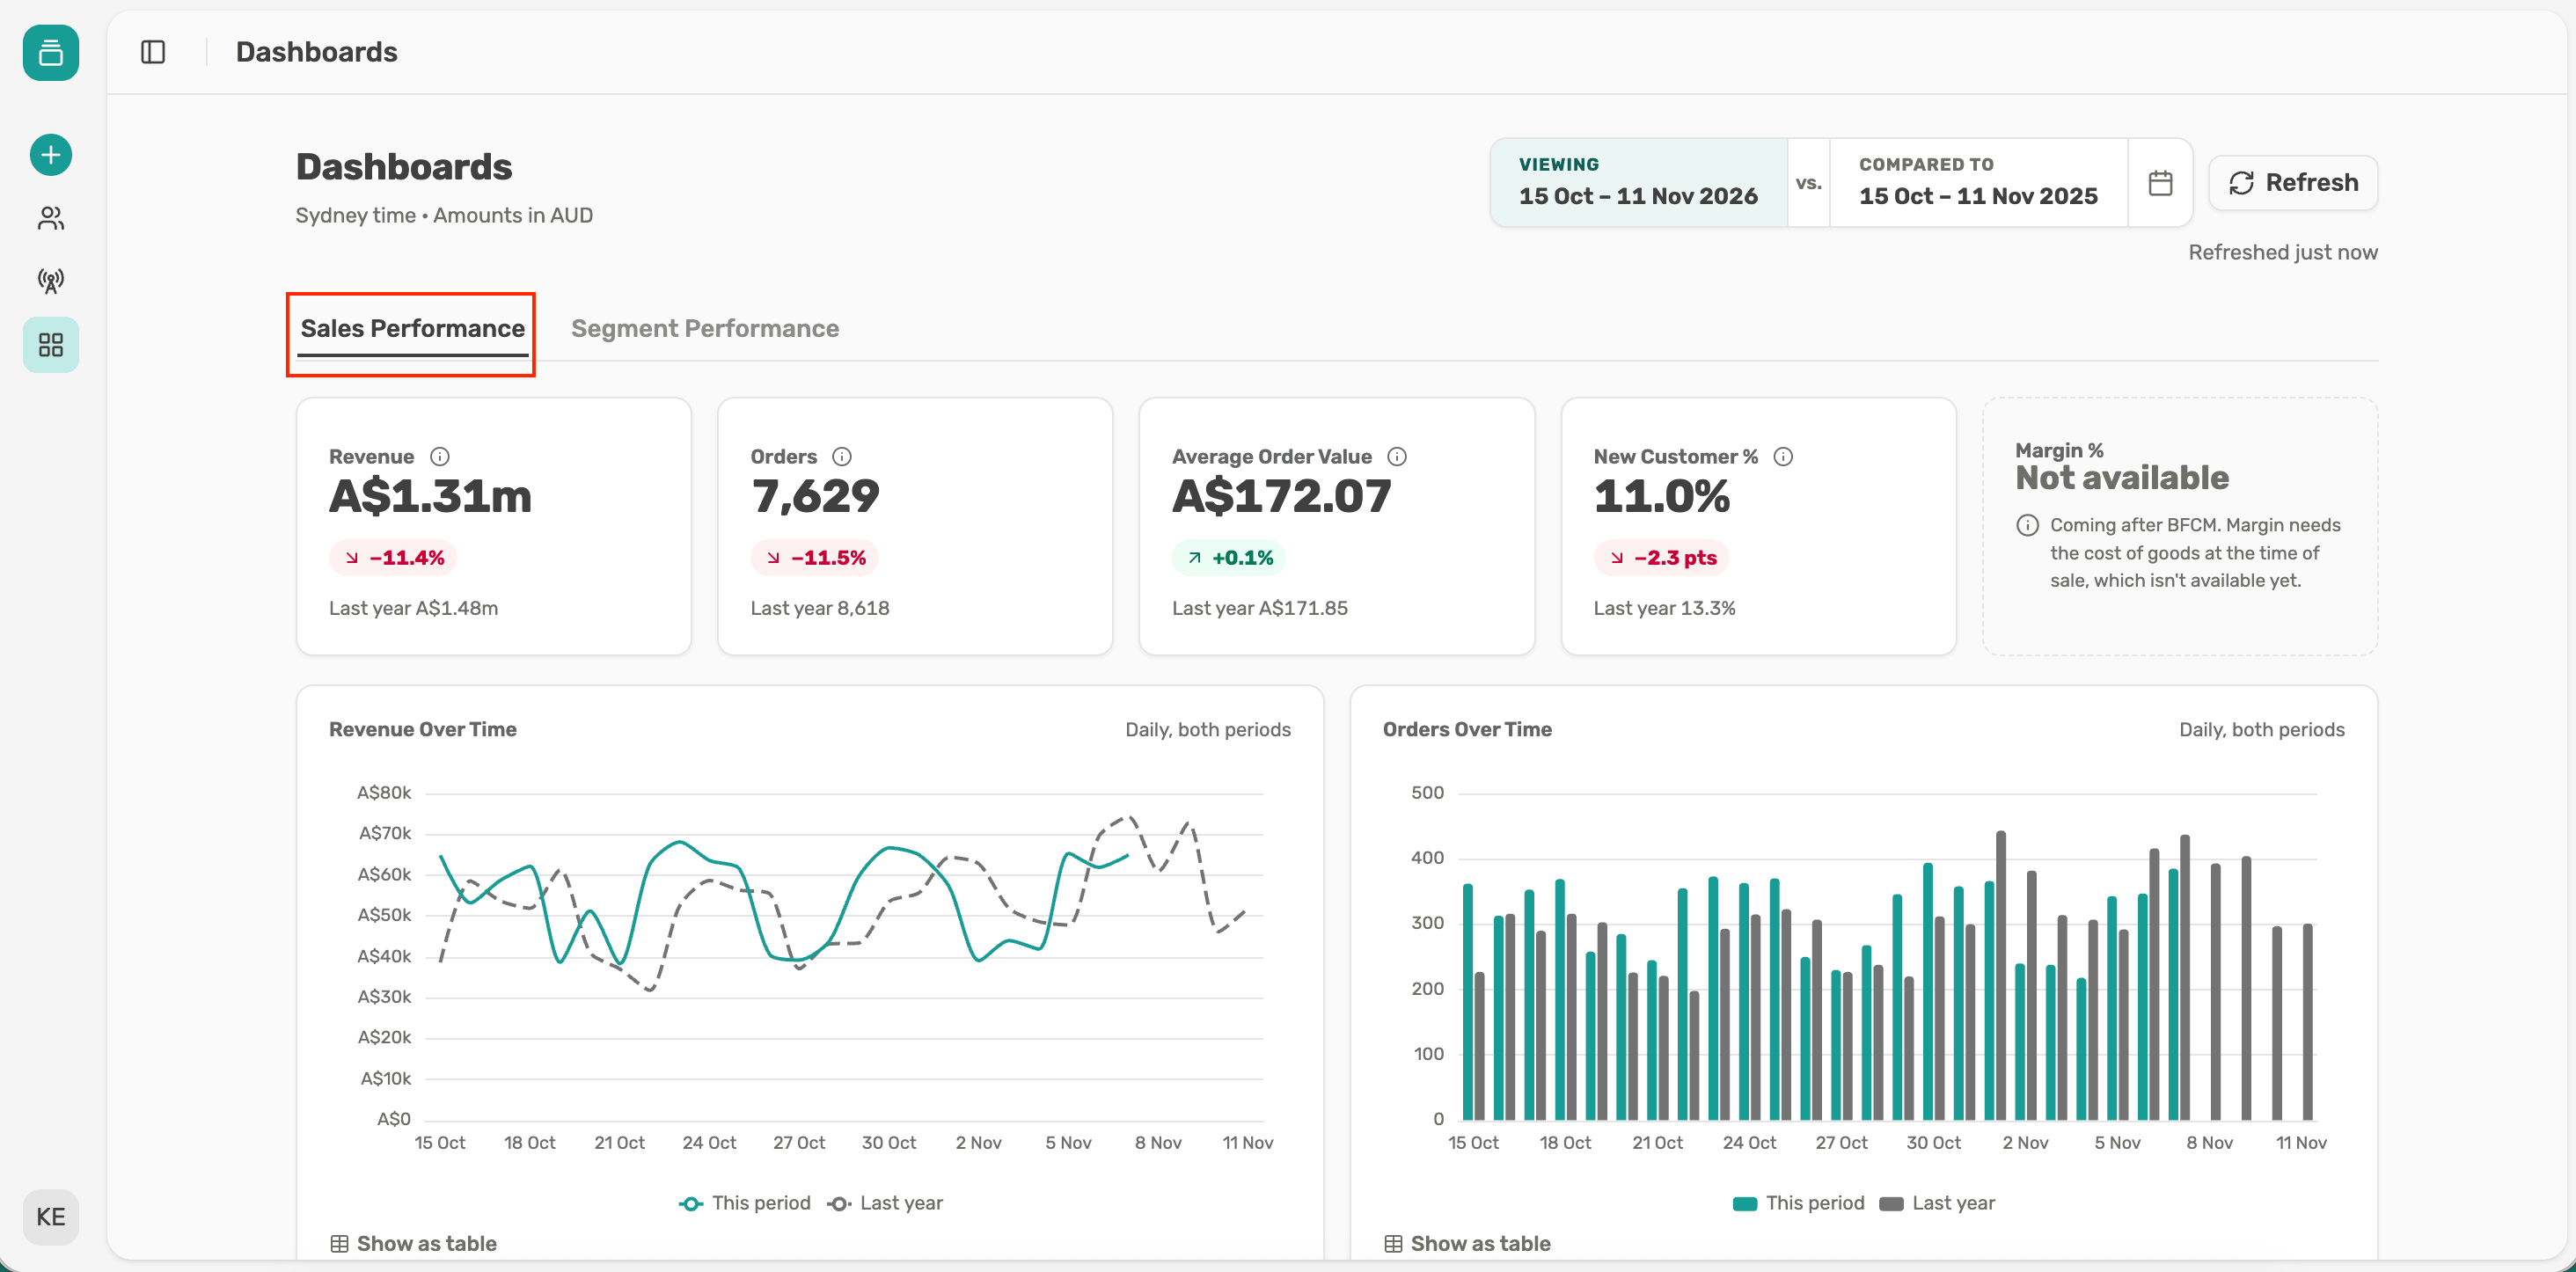
Sales Performance is about the whole business. Open it when the question is "how are we trading?"
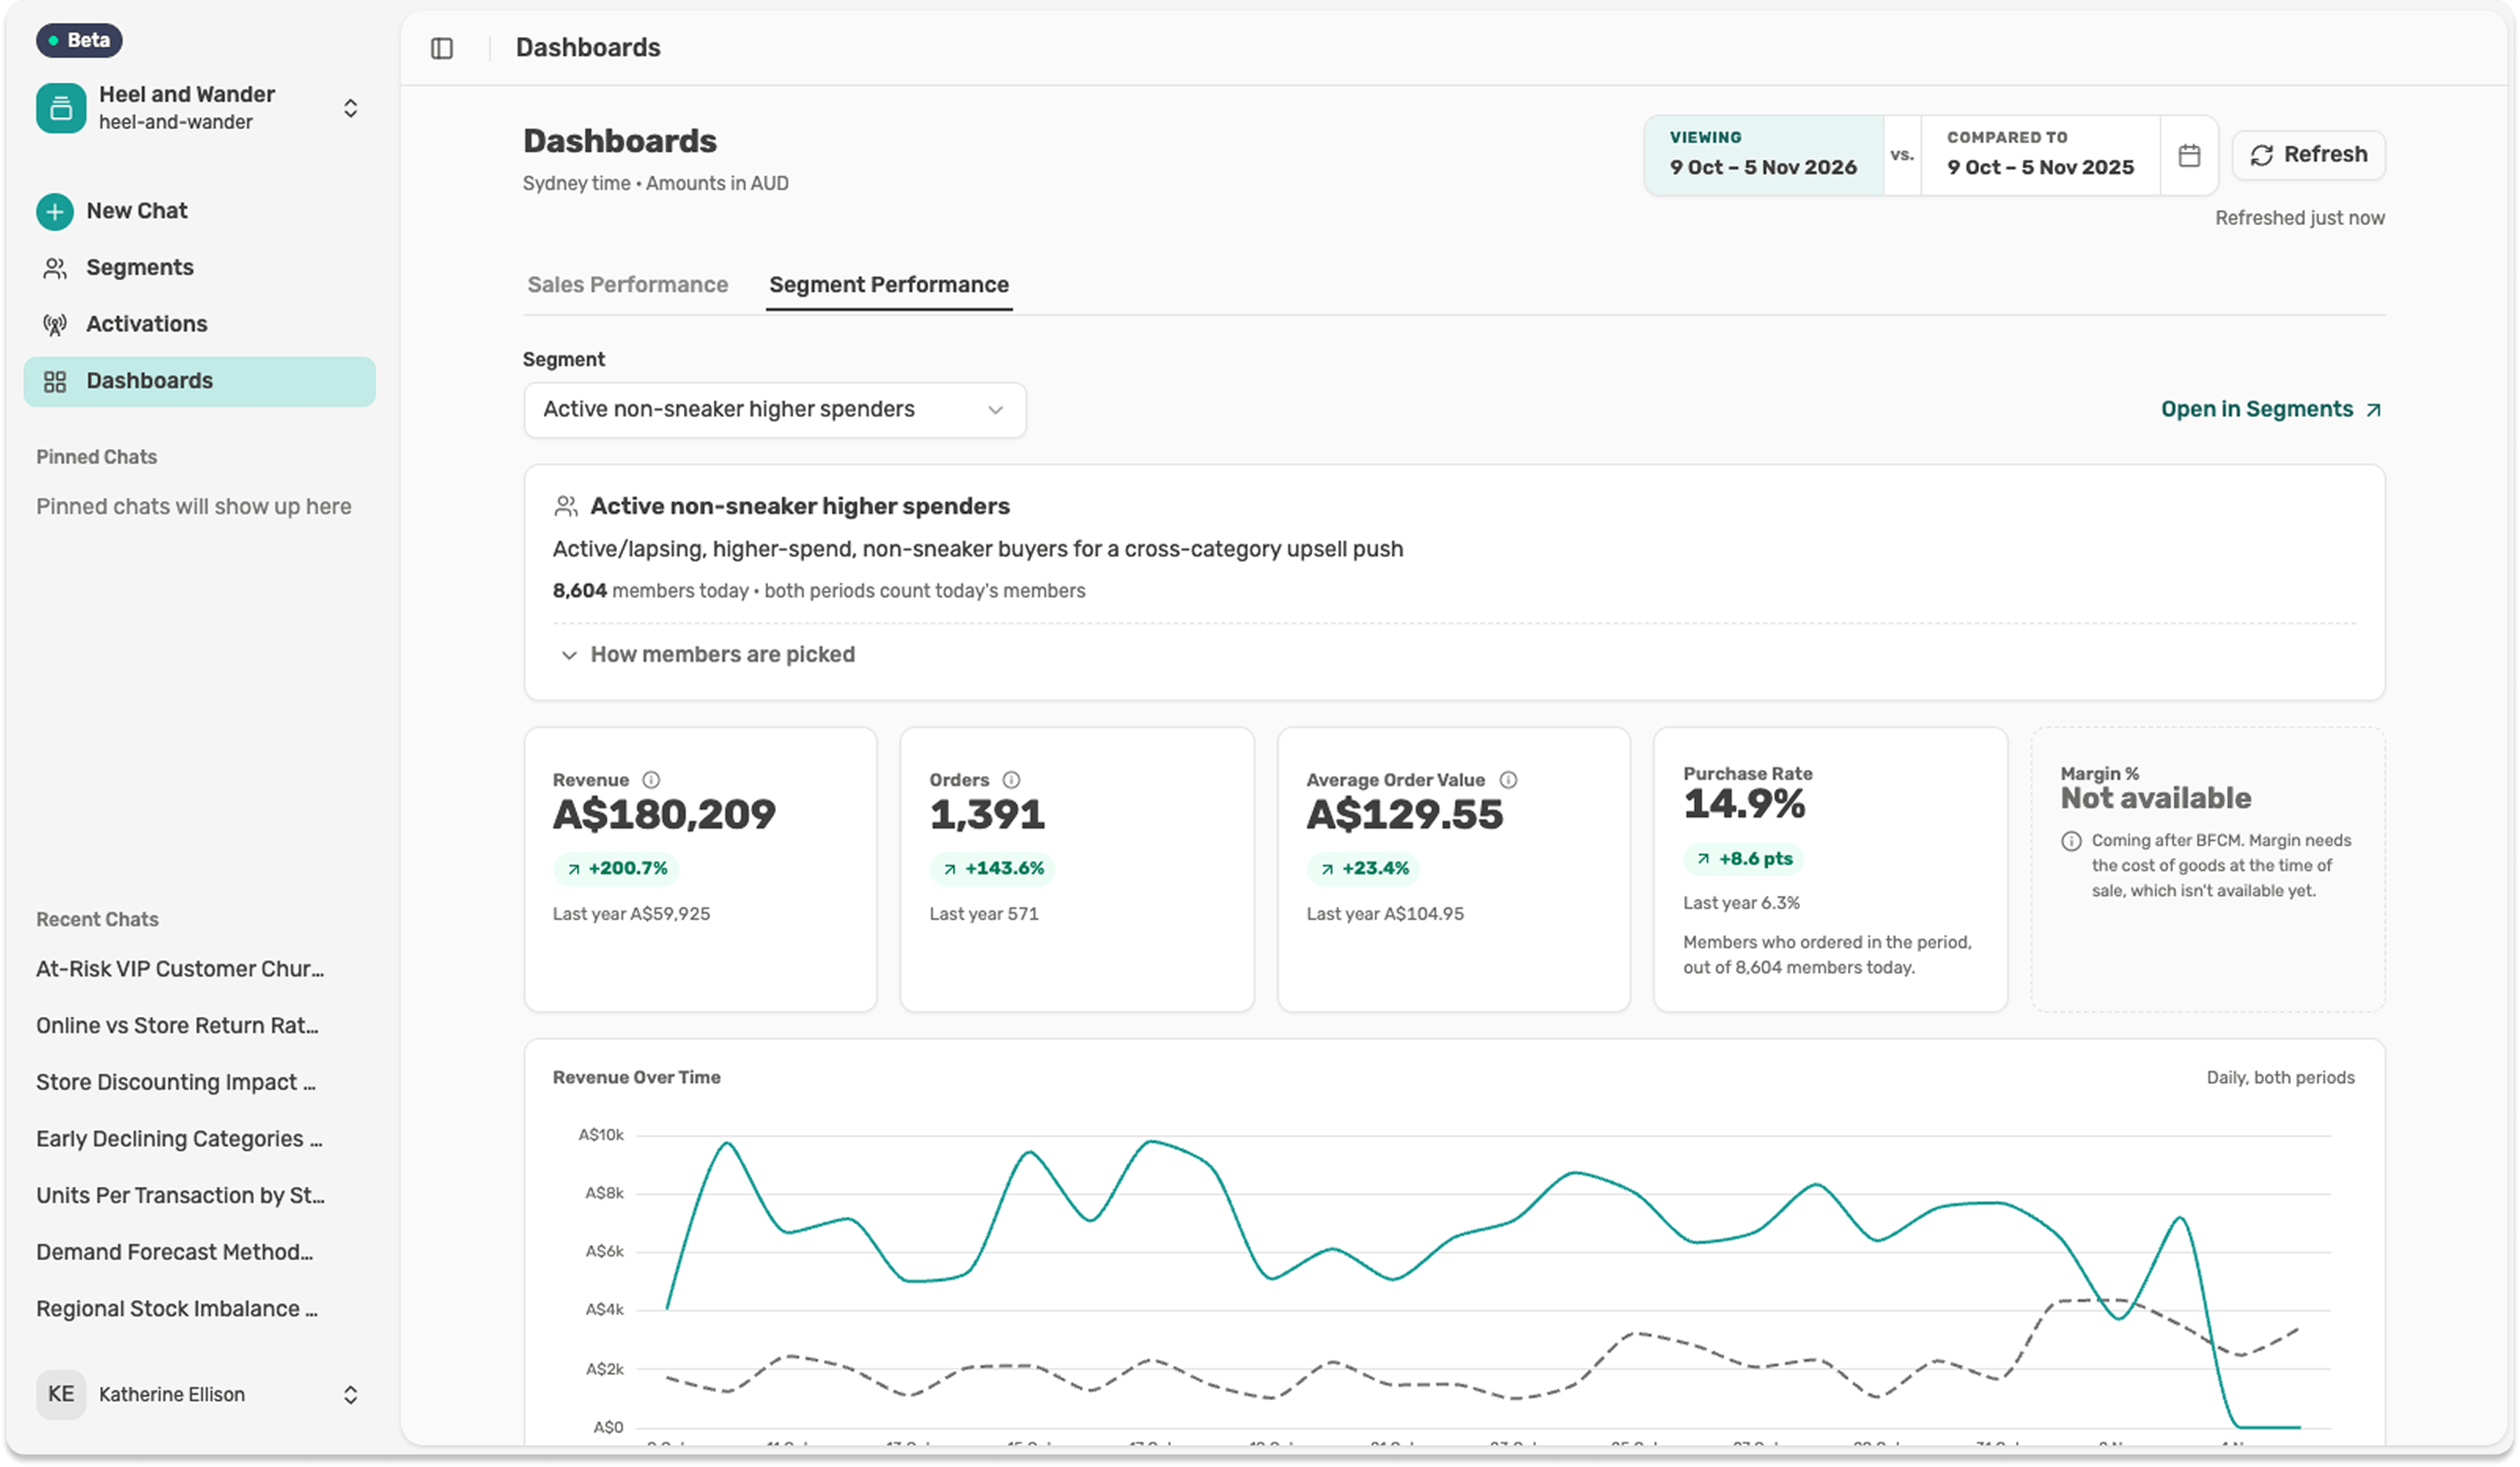
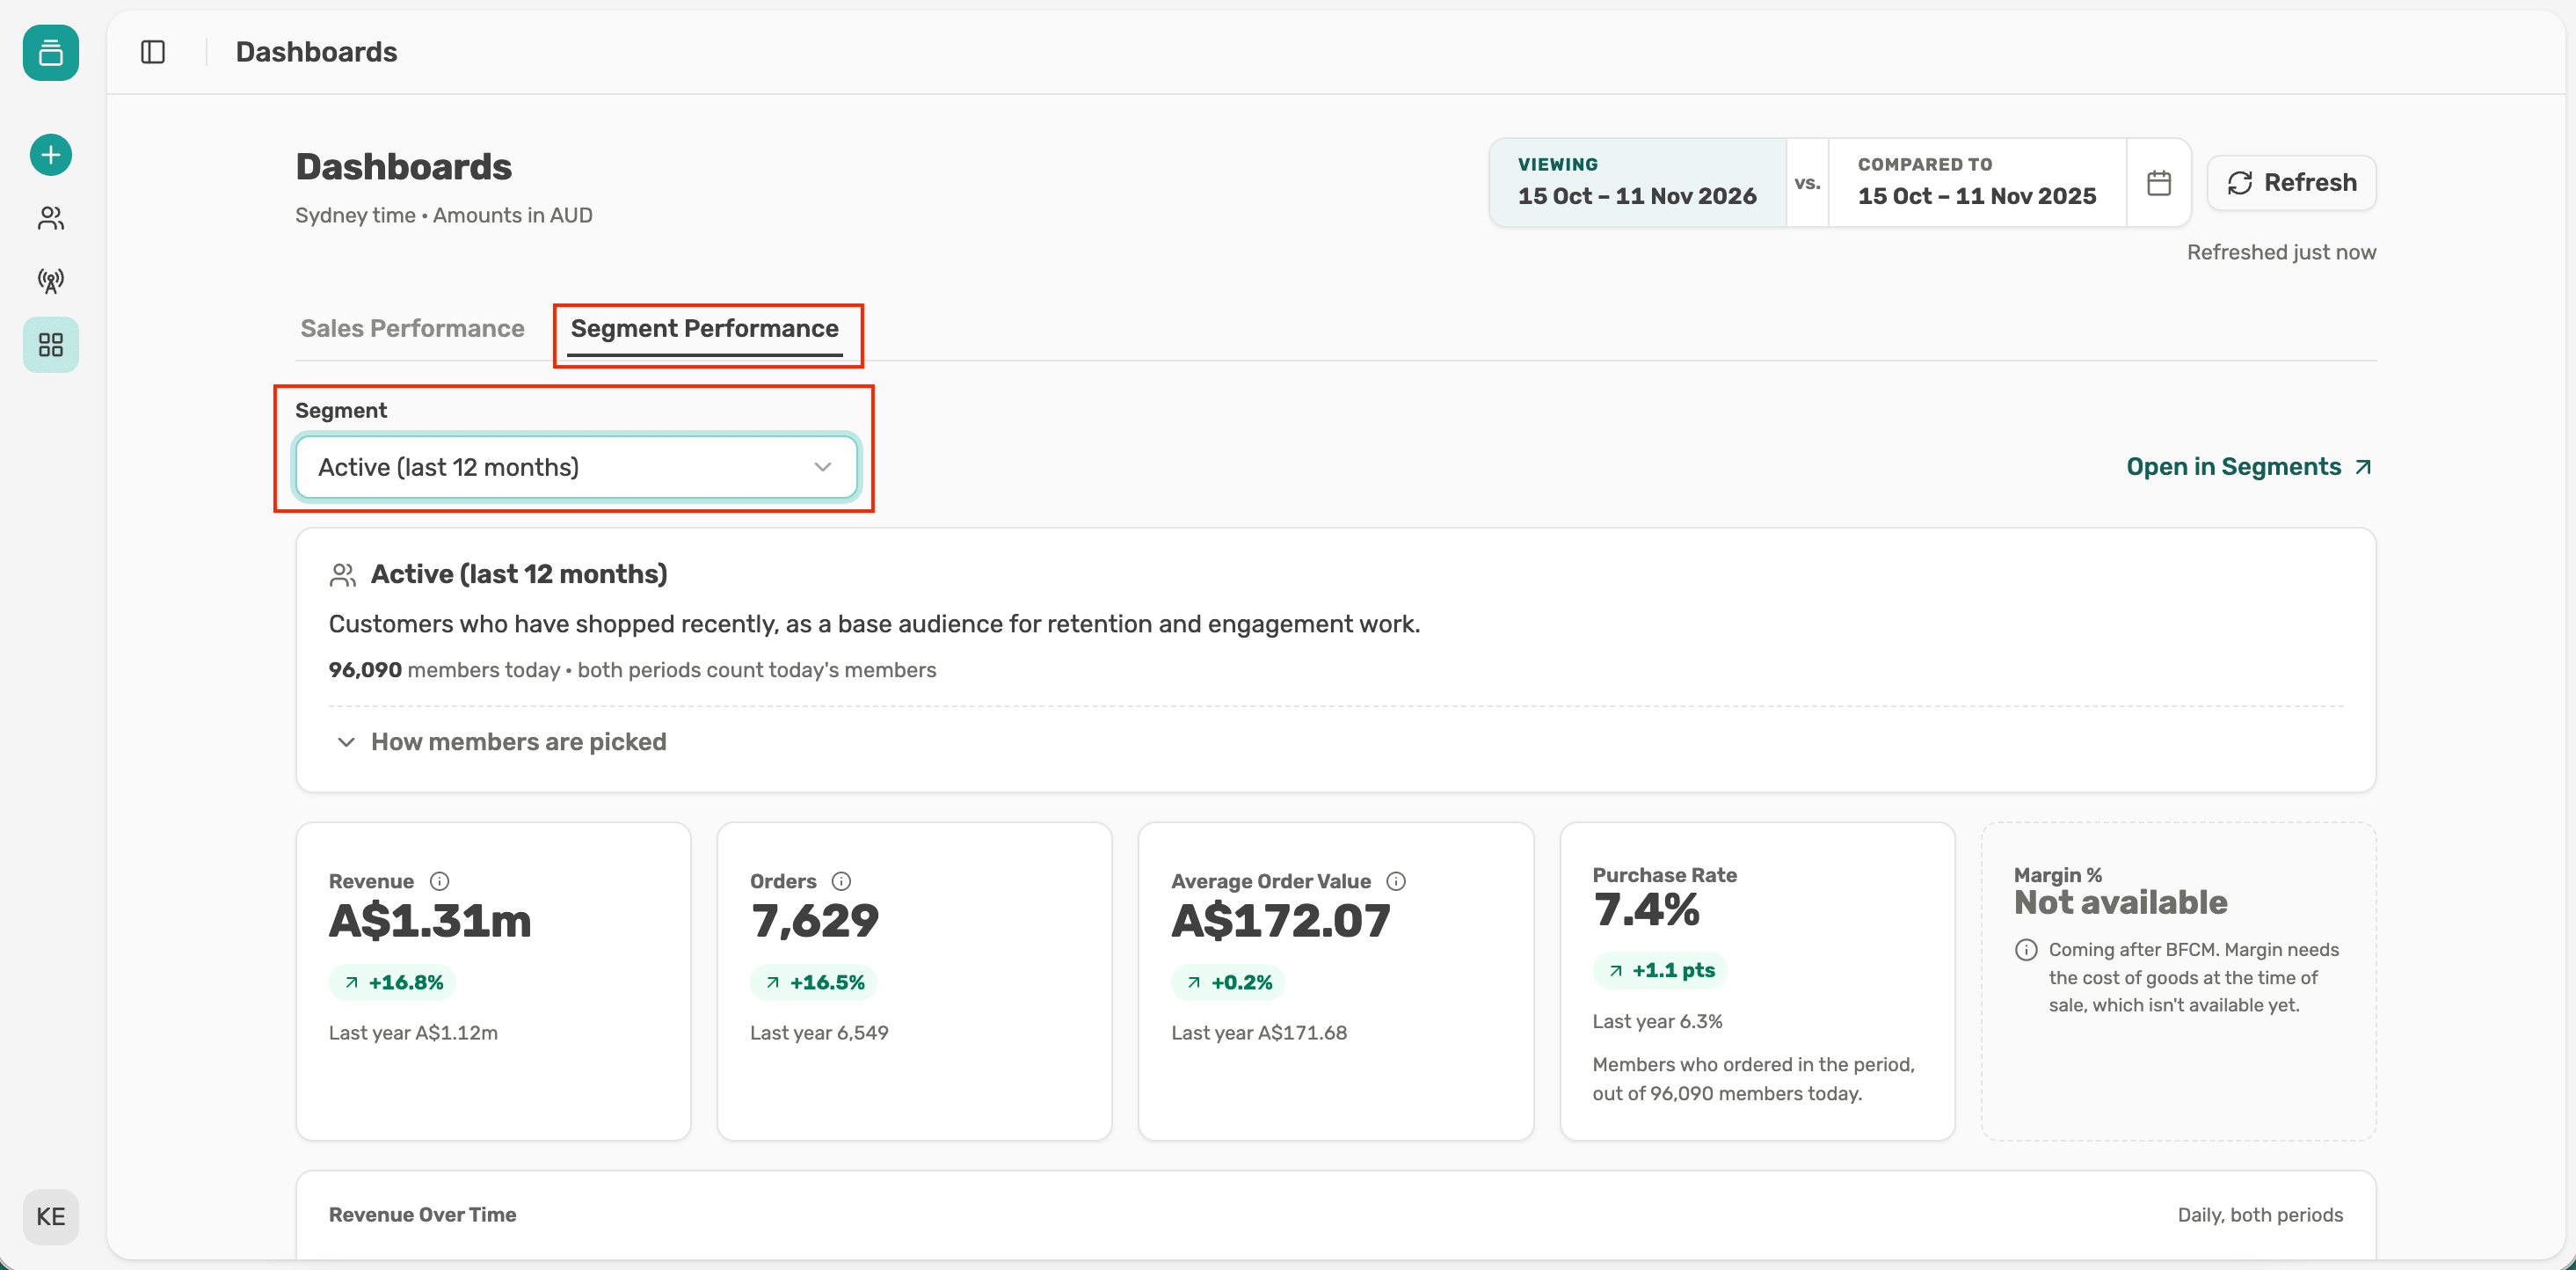
Segment Performance is about one saved segment. Open it when the question is "how is this group of customers doing?", such as your VIPs, lapsed customers or everyone who bought in the last sale.
Both tabs use the same dates, so you can switch between them without resetting anything.
Use it for a quick read on trading, compared with an earlier period:
The five cards give the headline numbers. The Over Time charts show where in the period a change happened, and Revenue by Channel shows where it came from. Select the ⓘ beside any card to see exactly what it measures. Margin % shows Not available for now.
Use it when you care about a specific group:
That last one is Purchase Rate, the share of members who ordered in the period. It's often the most useful number here. Revenue can rise because a few customers spent a lot, while Purchase Rate tells you whether the group as a whole is engaged.
The summary card shows how many members the segment has today. All the figures below it cover those members only. Select How members are picked to check the rules before you share the numbers.
By default, both tabs show the last 28 full days compared with the same weekdays a year earlier. Matching weekdays matters in retail, because a period with an extra weekend can look like growth when it isn't.
When you change the dates, compare like with like. Use a preset such as Black Friday to Cyber Monday for sale events, since the dates move each year. If you compare a sale period with a normal one, expect a gap that has nothing to do with performance.
Check Latest order at the top of the page. Data loads about every 6 hours, so the most recent days can look low simply because their orders haven't arrived. A message like "Orders after 1 Oct aren't in yet" means the data is still coming, and sales haven't dropped.
The two tabs work best as a pair. Spot a change in Sales Performance, then check your key segments to see who's behind it. When you want to dig into why, select Open in Segments, or bring the segment into a chat with @ and ask Lexi.
To share what you found, copy the page address. Your colleague sees the same tab, dates and segment. You can also export any chart as an image for a deck.