
Read Sales Performance
See your whole business at a glance, compared with an earlier period.
Read the cards
Five cards show Revenue, Orders, Average Order Value, New Customer % and Margin %, in your own timezone and currency. Select the ⓘ beside a title to see what it measures. Margin % shows Not available for now.
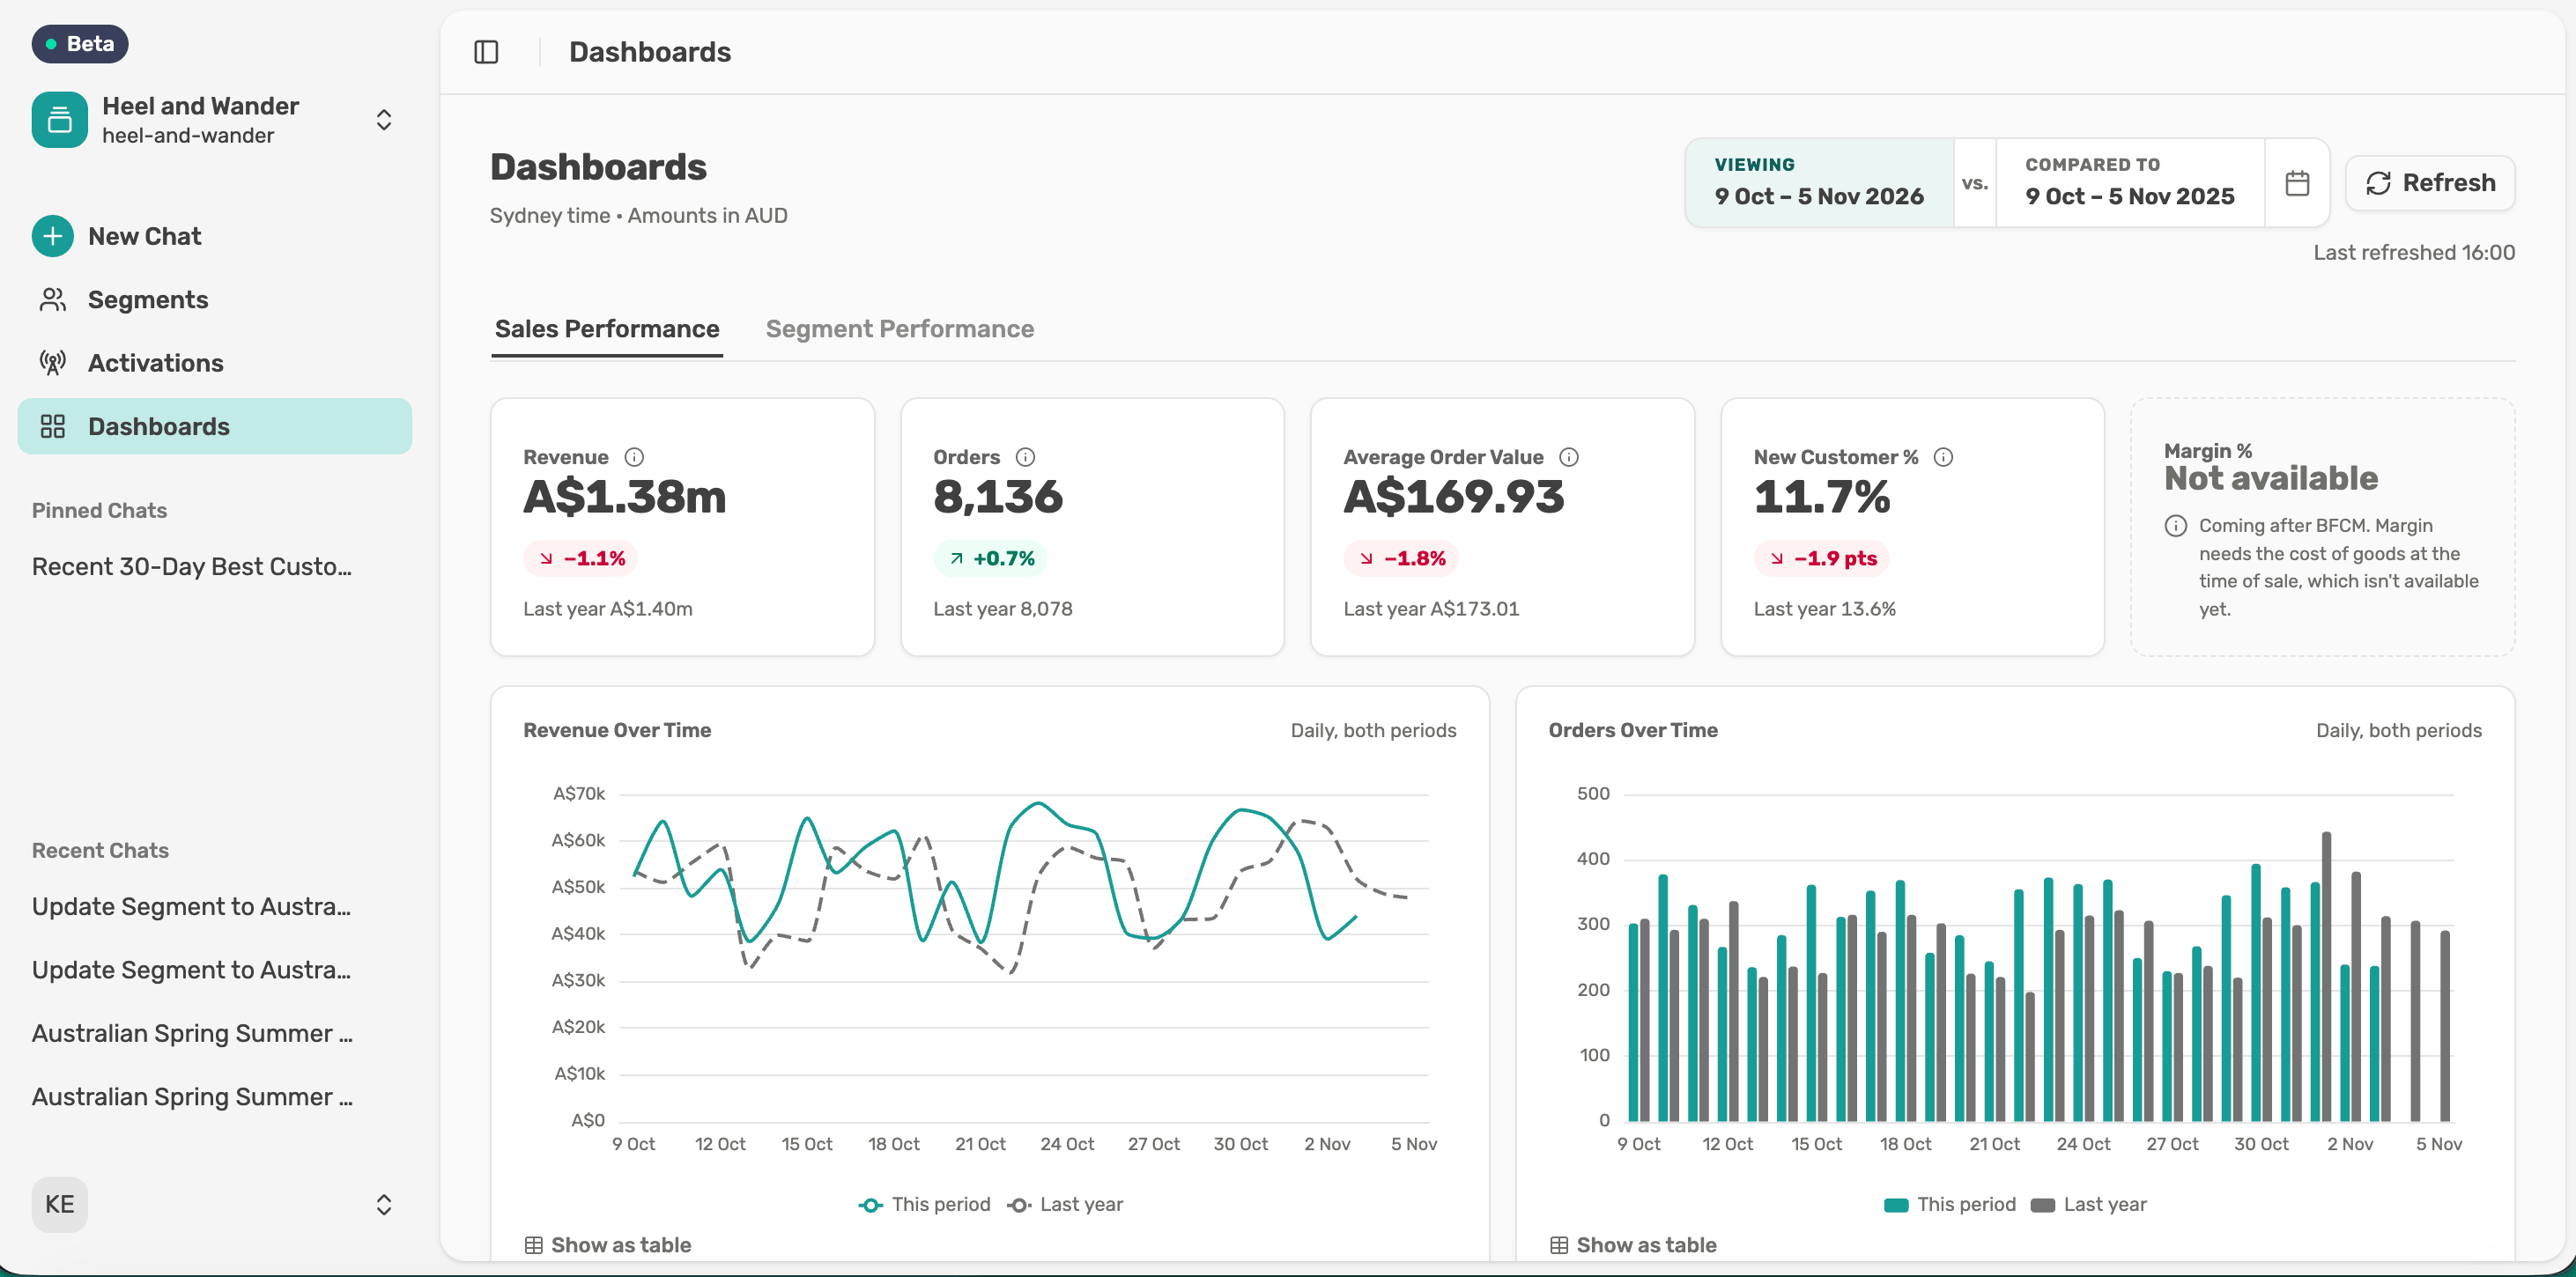
Change the dates
The default is the last 28 full days, compared with the same weekdays a year earlier. Select the dates at the top to pick a new period or comparison, including presets like Black Friday to Cyber Monday. Select Refresh to reload the numbers.
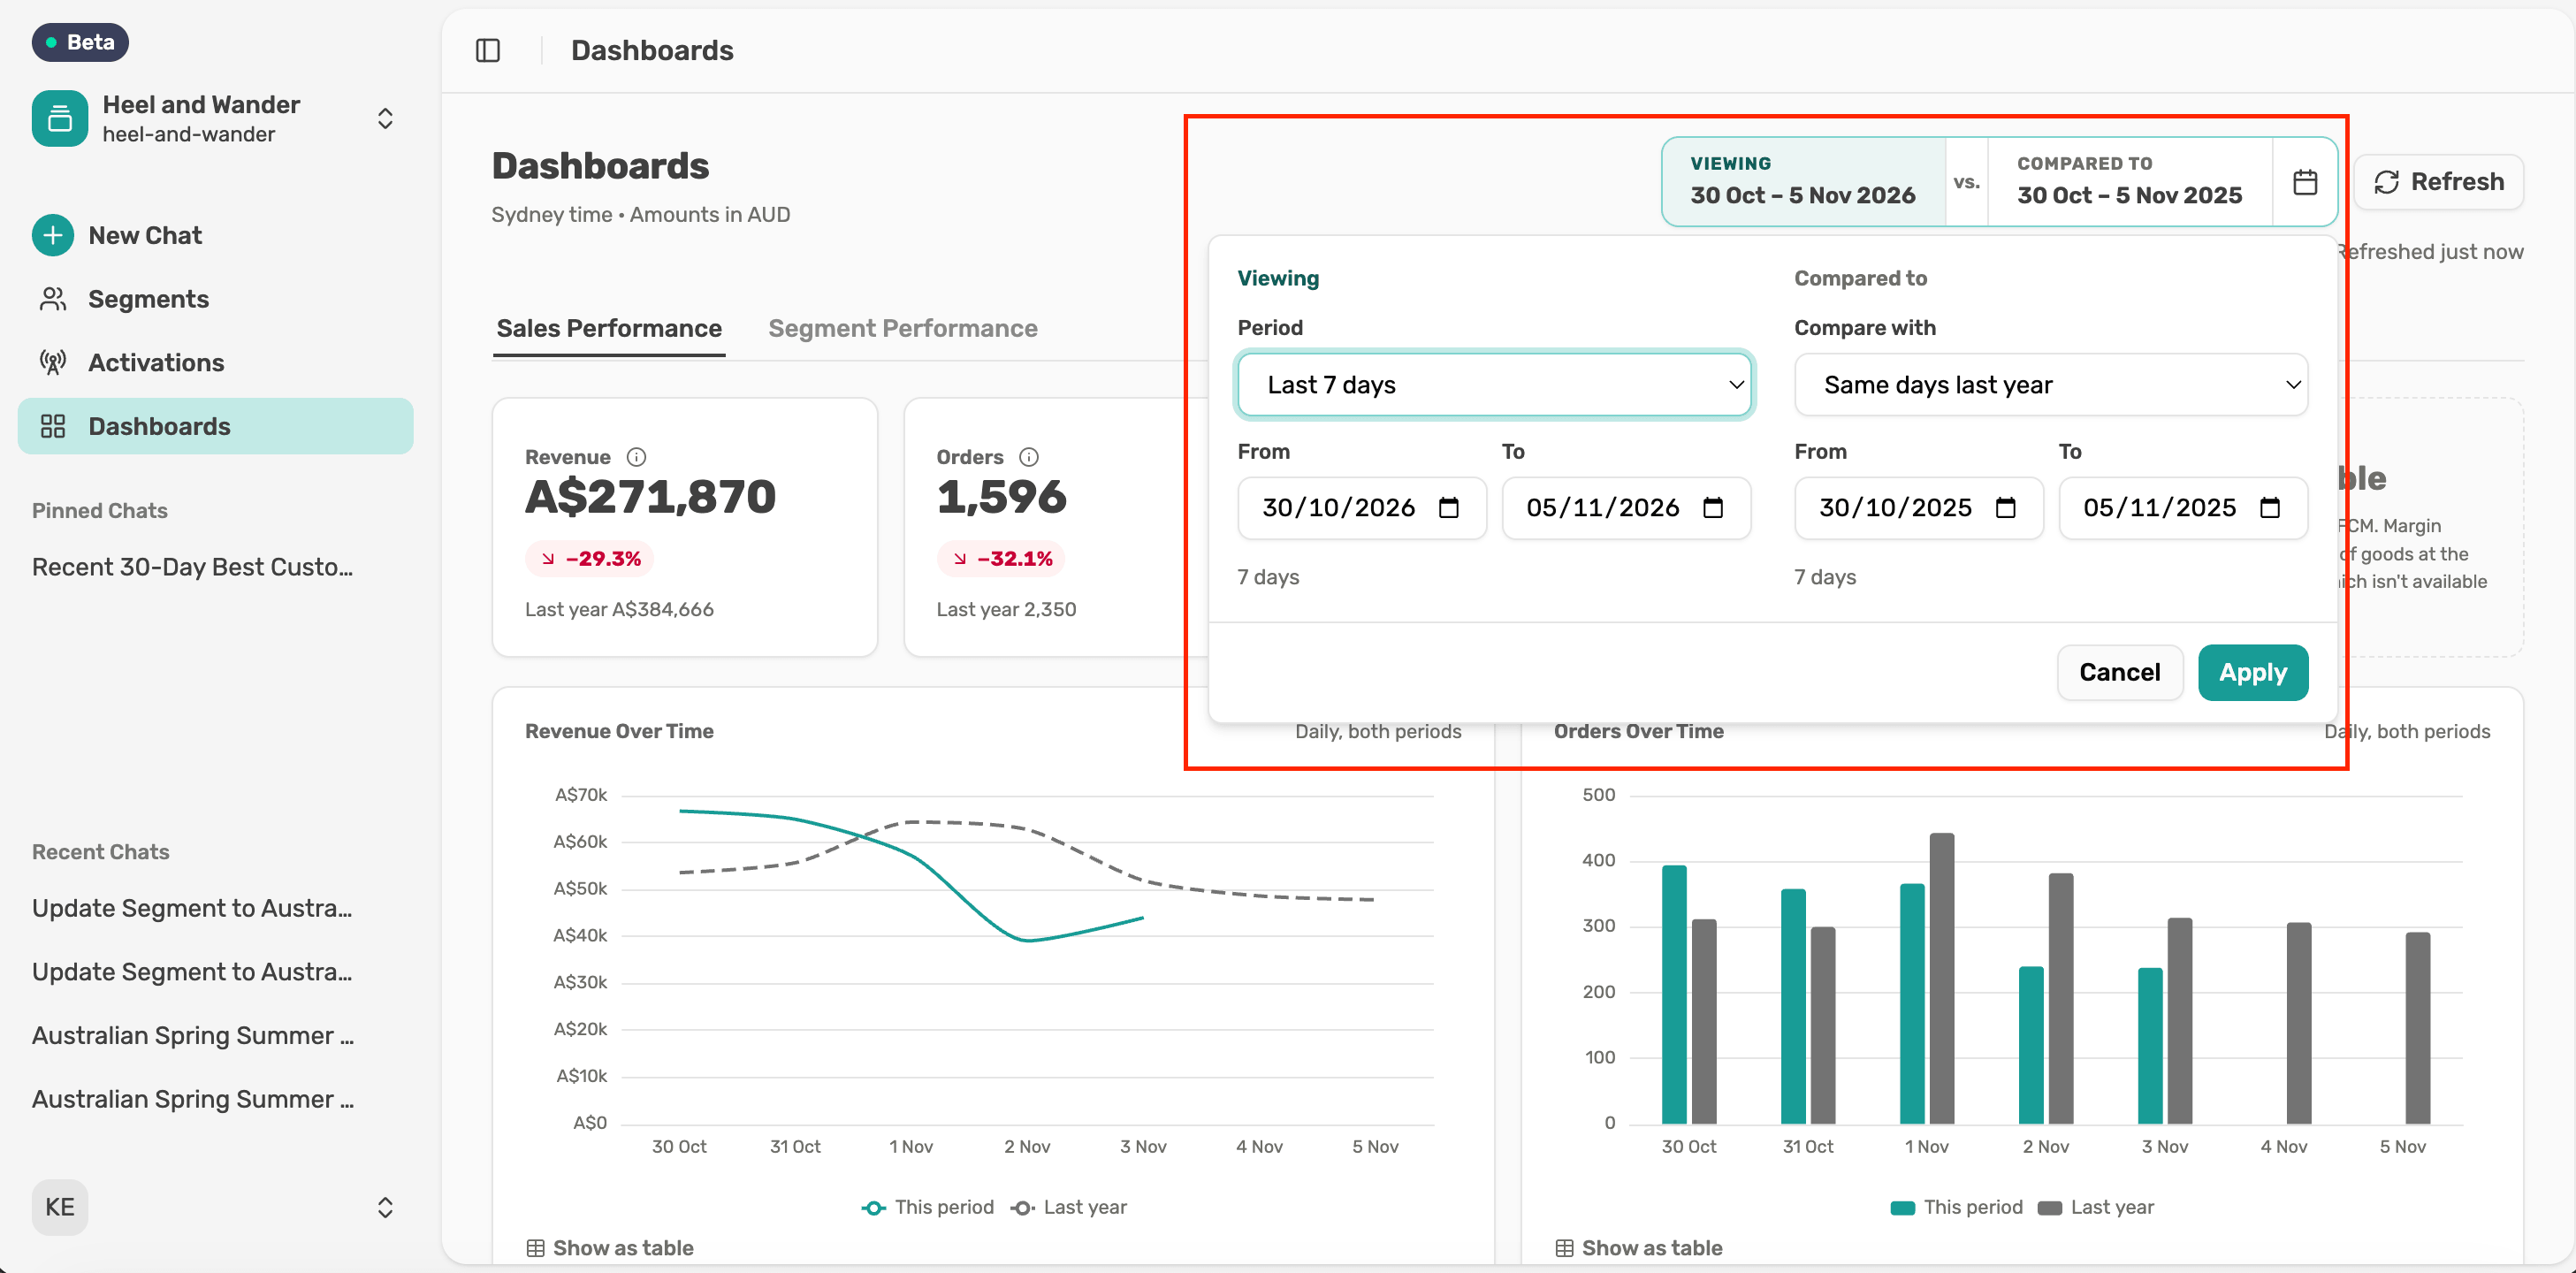
Explore the charts
The Over Time charts show each number by day for both periods. Select Show as table to see the days as a list. Revenue by Channel shows which sales channels brought in the most.
Export a chart
Select the download button on any chart to export it as a table (CSV) or an image (PNG). Images come on a white background, ready for a deck.
Numbers look low for recent days? Check Latest order at the top. Data loads about every 6 hours, so a message like “Orders after 1 Oct aren't in yet” means the data hasn't arrived, and sales haven't dropped.