
Activity overview
An introduction to team reporting in Activity
This article will help you navigate to the right place to see agent performance data, and help you keep up to date with your team’s activity through six areas of reporting.
What is Activity?
Lexer Activity holds all the data you need to effectively report on agent and team performance. Here you can also keep track of account security, with a log of all actions performed in your account.
Activity has six unique reporting areas - each of these yield different data, and are designed to help you find answers. The data for each report is composed of agents’ performance metrics in Lexer Respond, and Lexer Listen. Every page can be sorted by user groups and individuals, and is available for instant export to CSV, for your own analysis.
Tour of Activity
To understand the current state of your team’s performance, the Summary and Team reports will give you the most amount of detail.
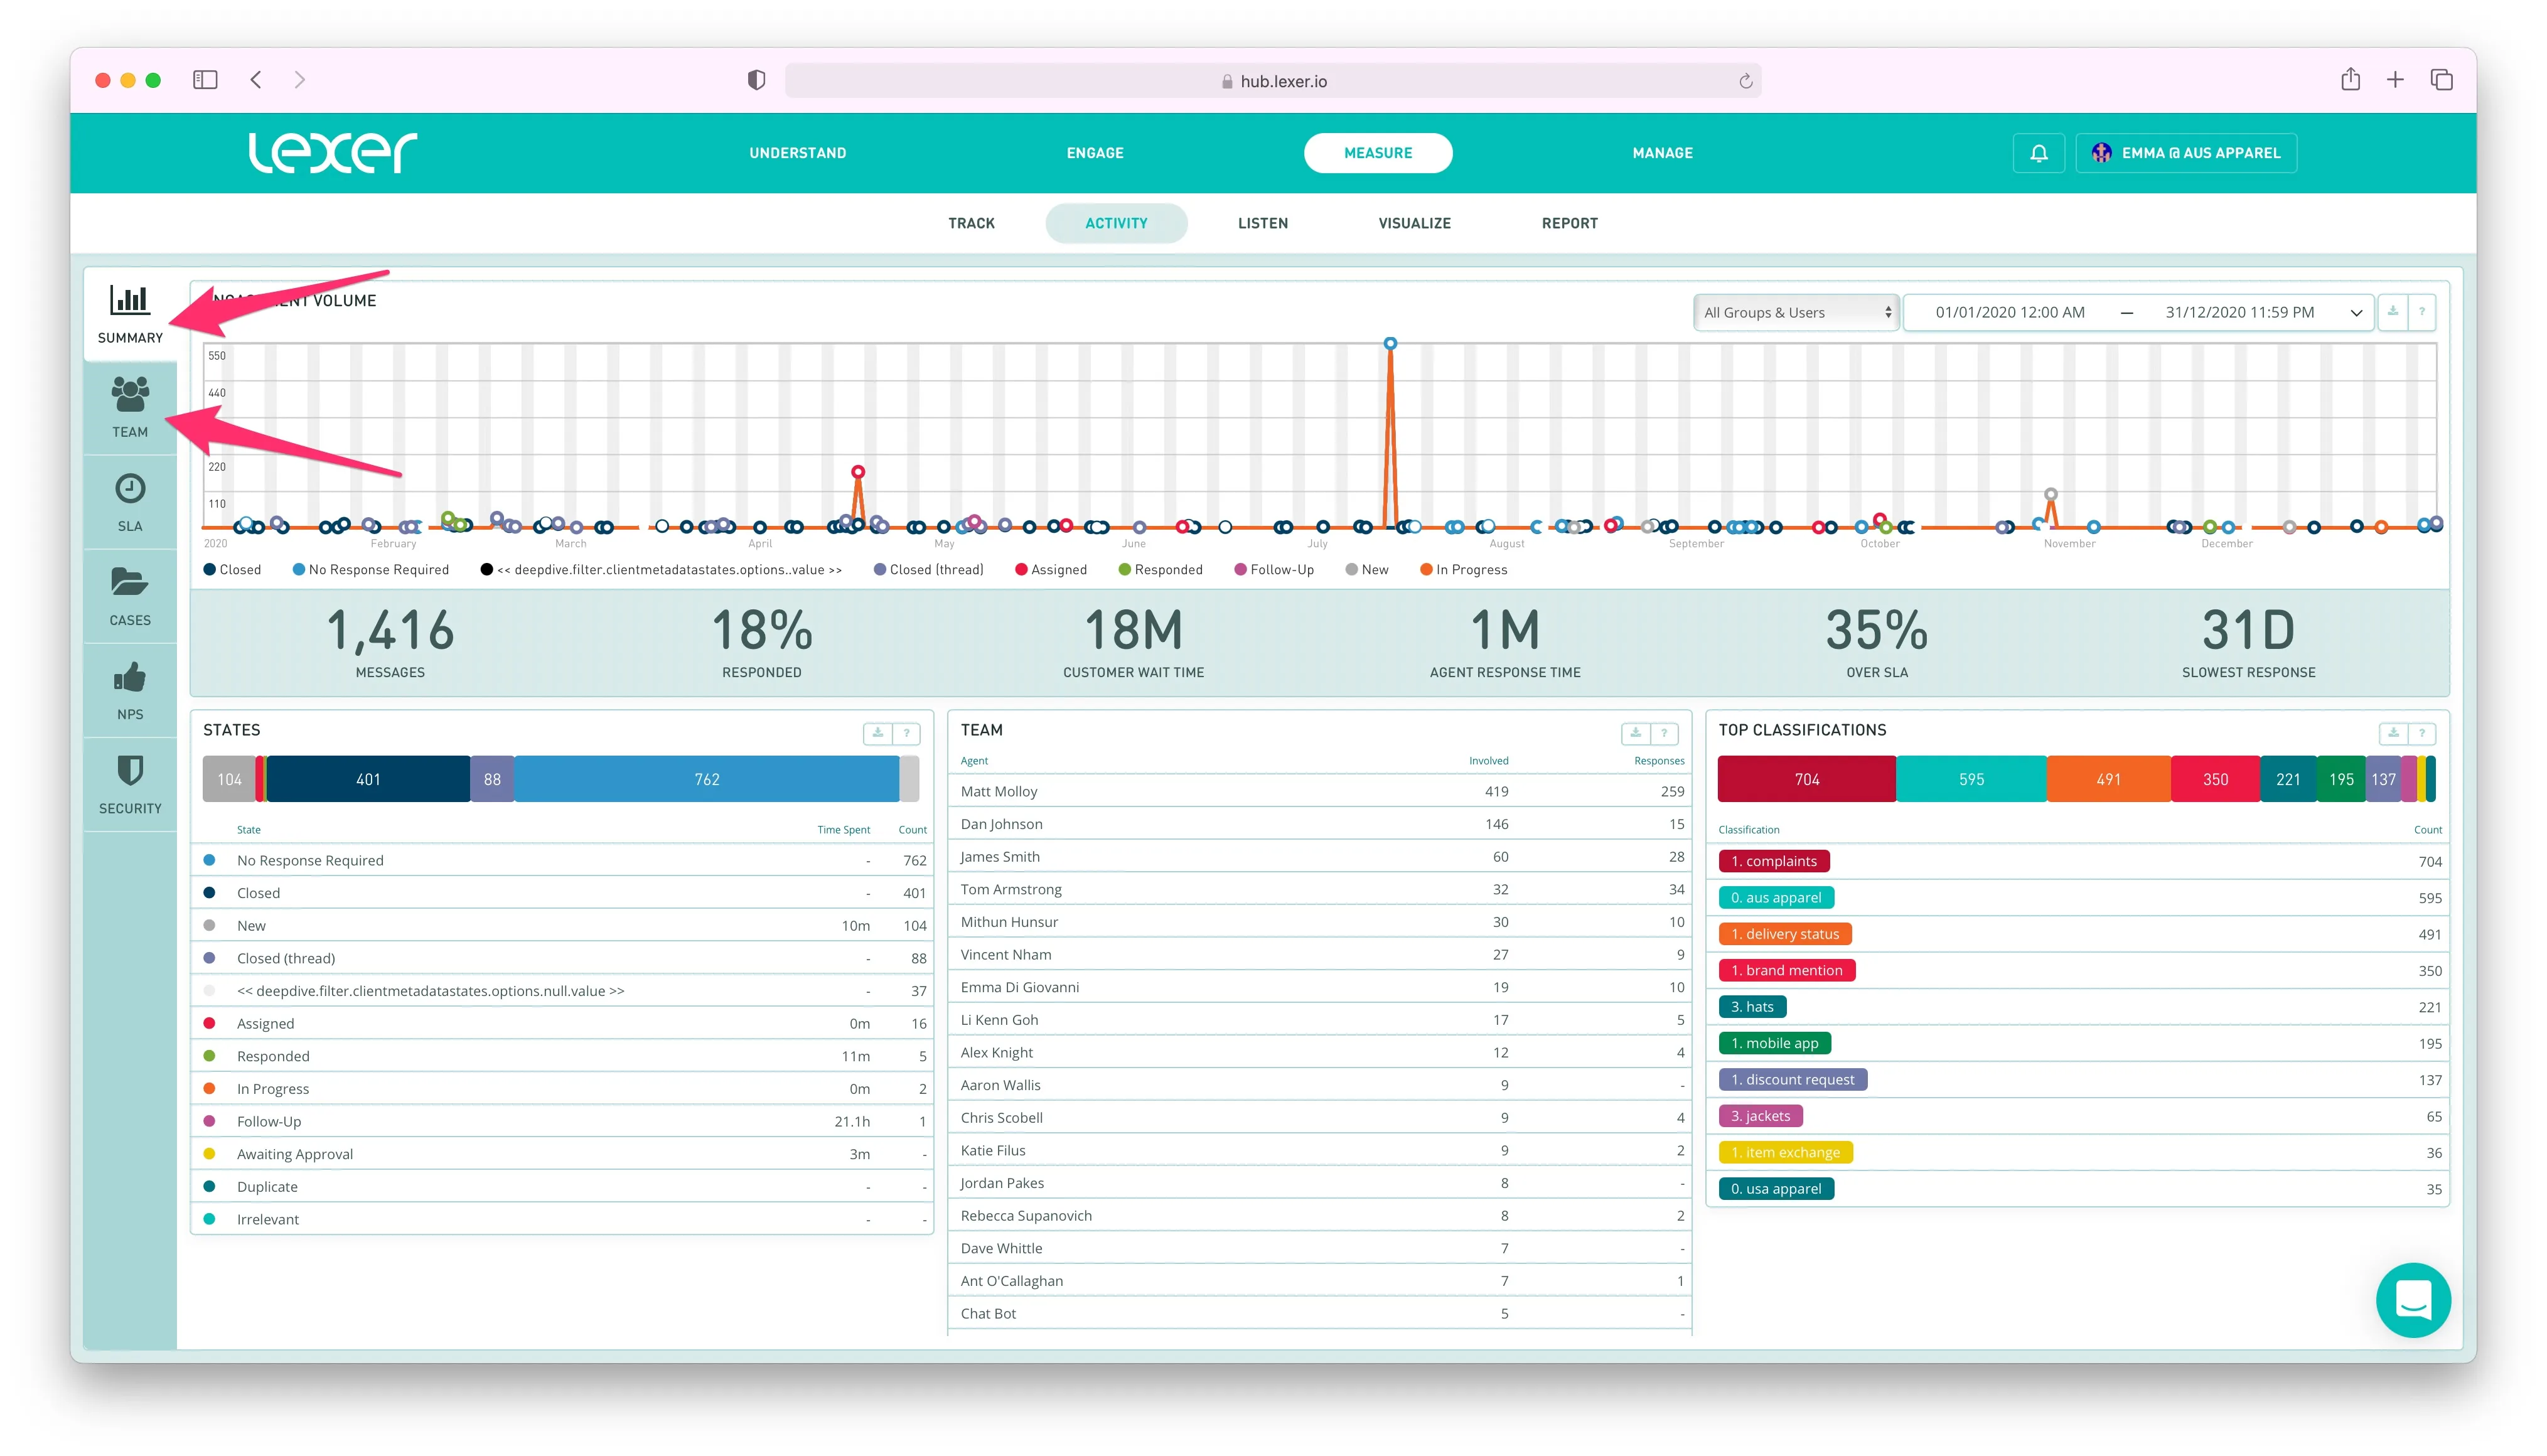
- Summary: The summary page is filled with data on the actions that your teams & agents have performed inside of Lexer. Here you can see summaries for team reporting on response rates, topics of content, volume and speed of replies, SLA metrics and the amount of time your customers have spent waiting for an agent.
- Team: Get a deeper inside scoop on what your team are up to right now. Find out how many open objects are currently assigned to different agents, how many each agent is involved in, and the volume your team have handled. The Team report is exportable, for insights that can easily be shared within organization.
To explore responses, classifications, SLA’s, response times, and various key performance metrics, check out SLA and Cases.
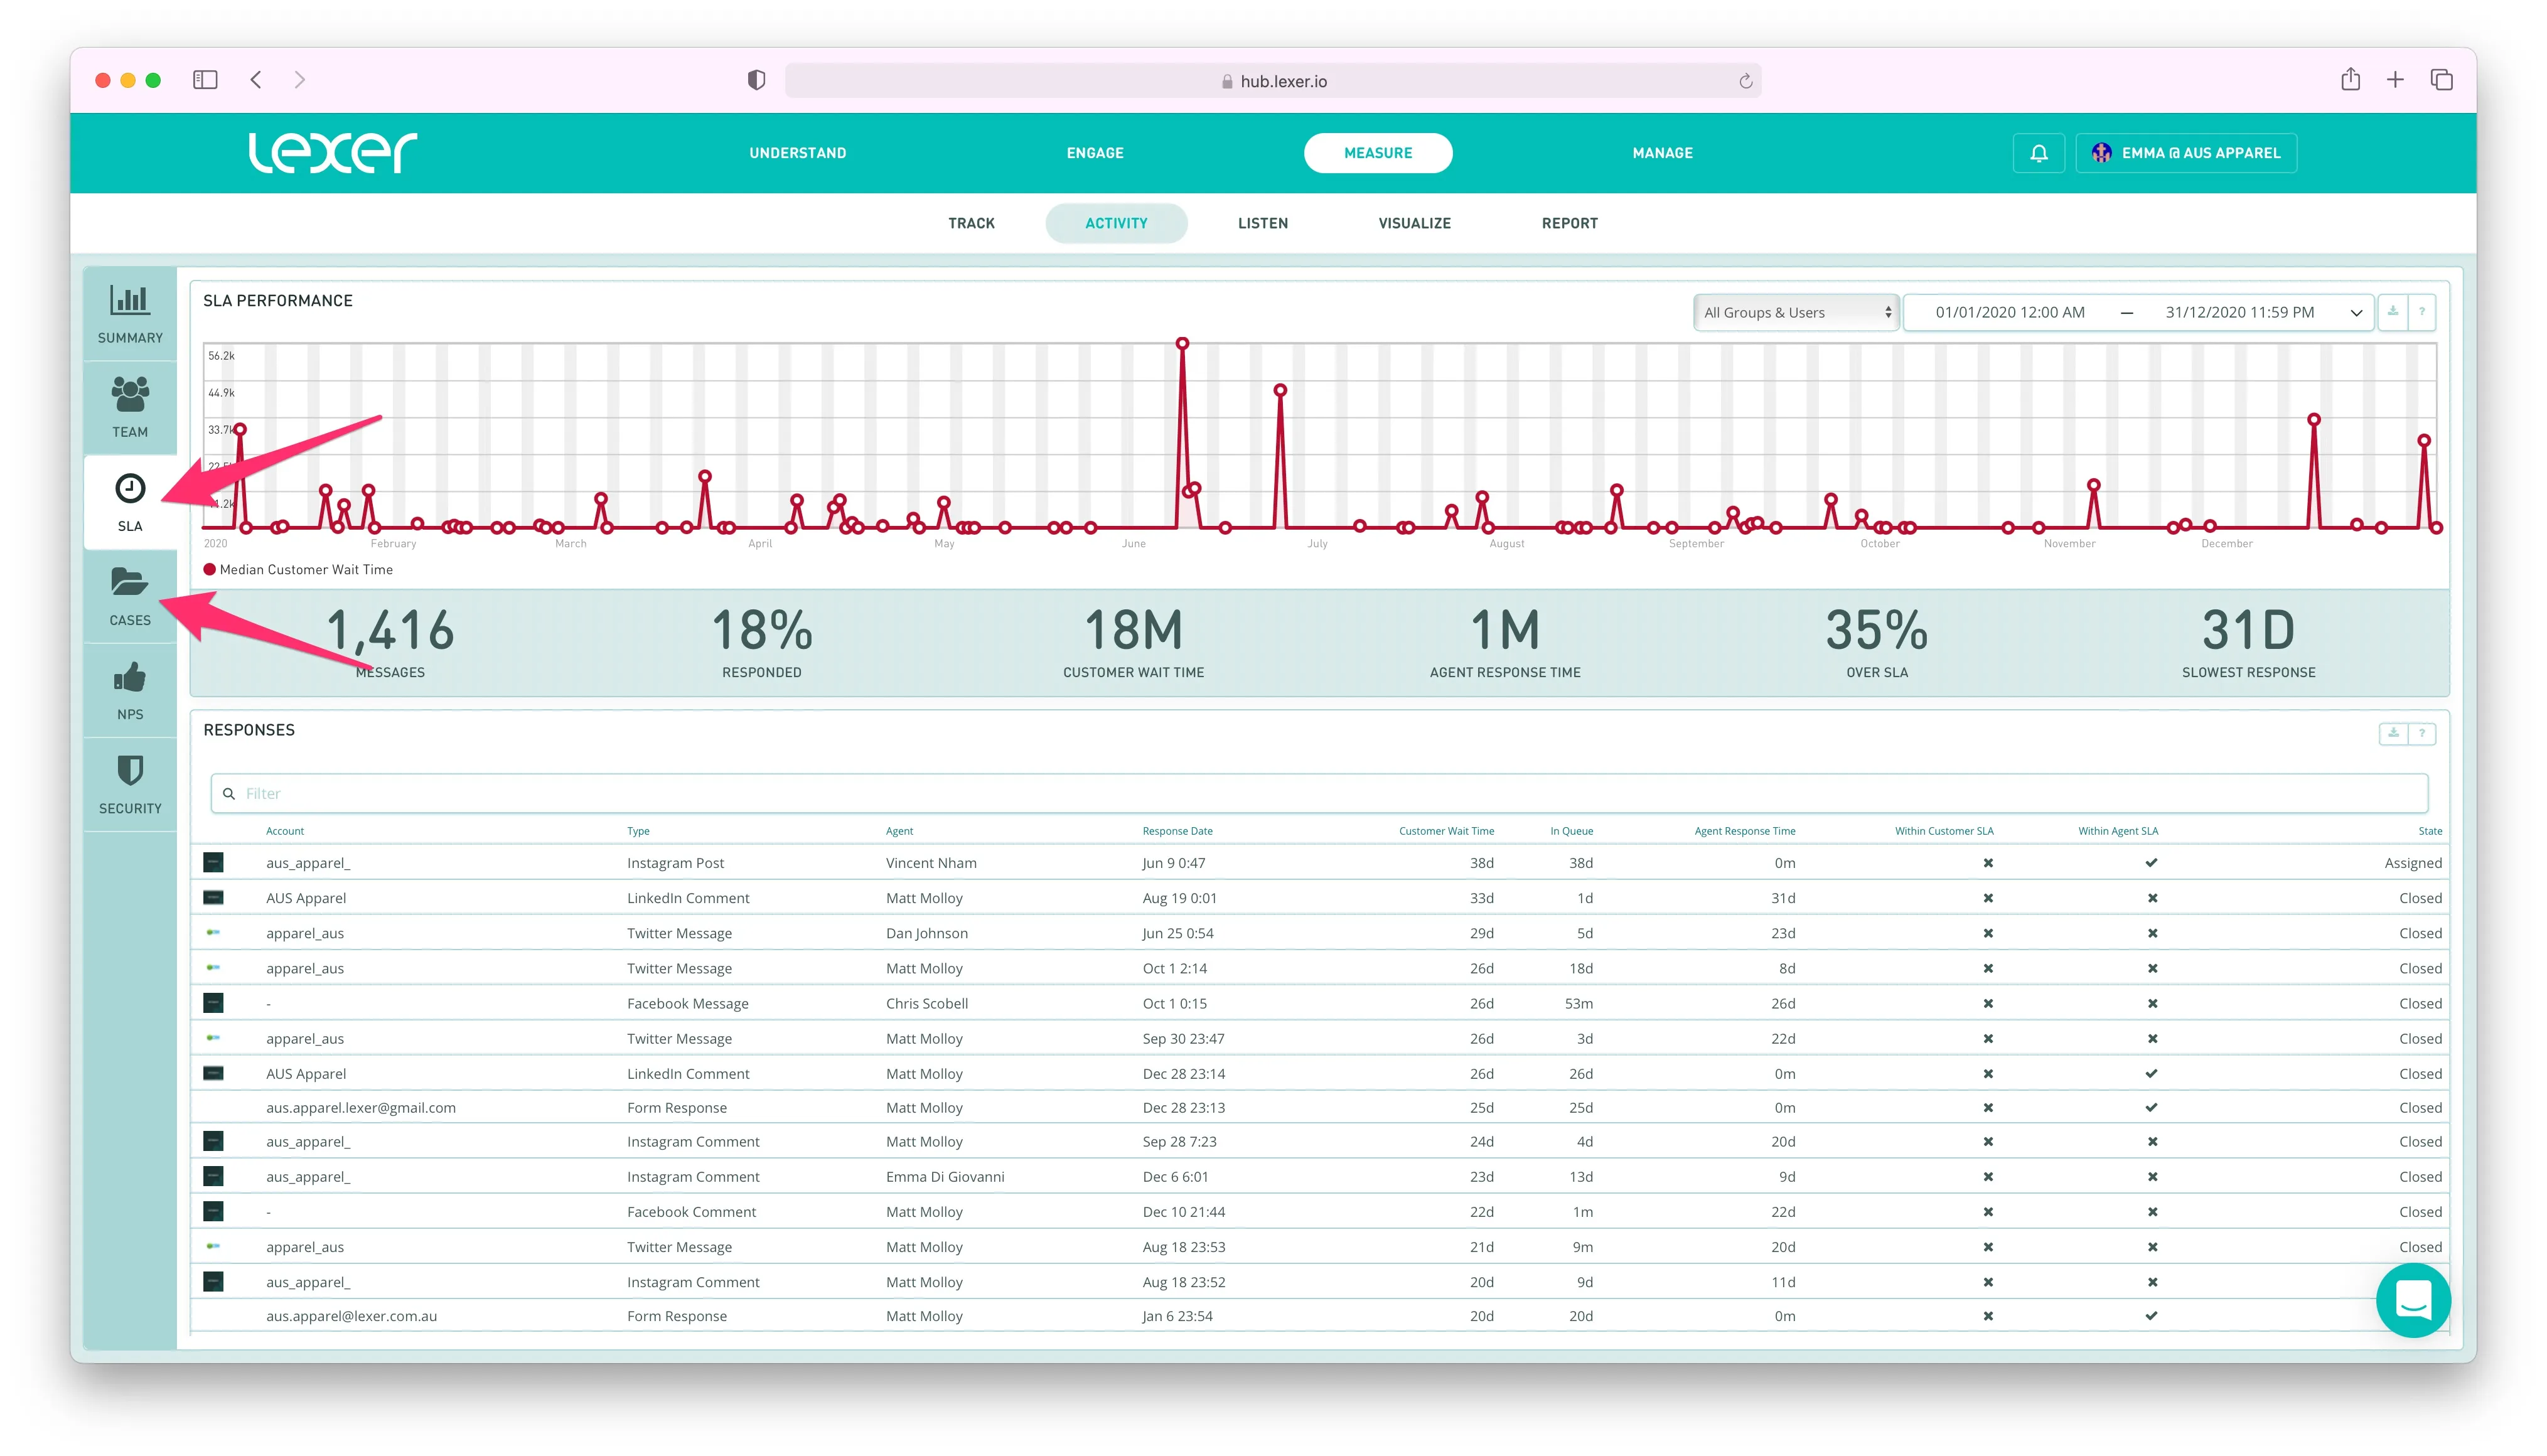
- SLA: Take a look at the content your agents have created, and get a full understanding of conversational context as you read the responses within/outside of the SLA of your team. The SLA report considers every interaction as a unique object, and provides the SLA on each. This screen also includes a summary of average response times, so you can study lengthy response periods. Export data from the SLA report to get a glimpse of trending topics and sentiment.
- Cases: Get an understanding of what it takes for your team to close an engagement with a customer. Cases data contains entire conversations with response times, a full history of Classifications, lists of agents involved, and flags to indicate when NPS surveys have been sent. Export this data for highly detailed analysis.
For customer feedback on your agents’ performances, head to NPS and study the rankings provided by customers themselves.
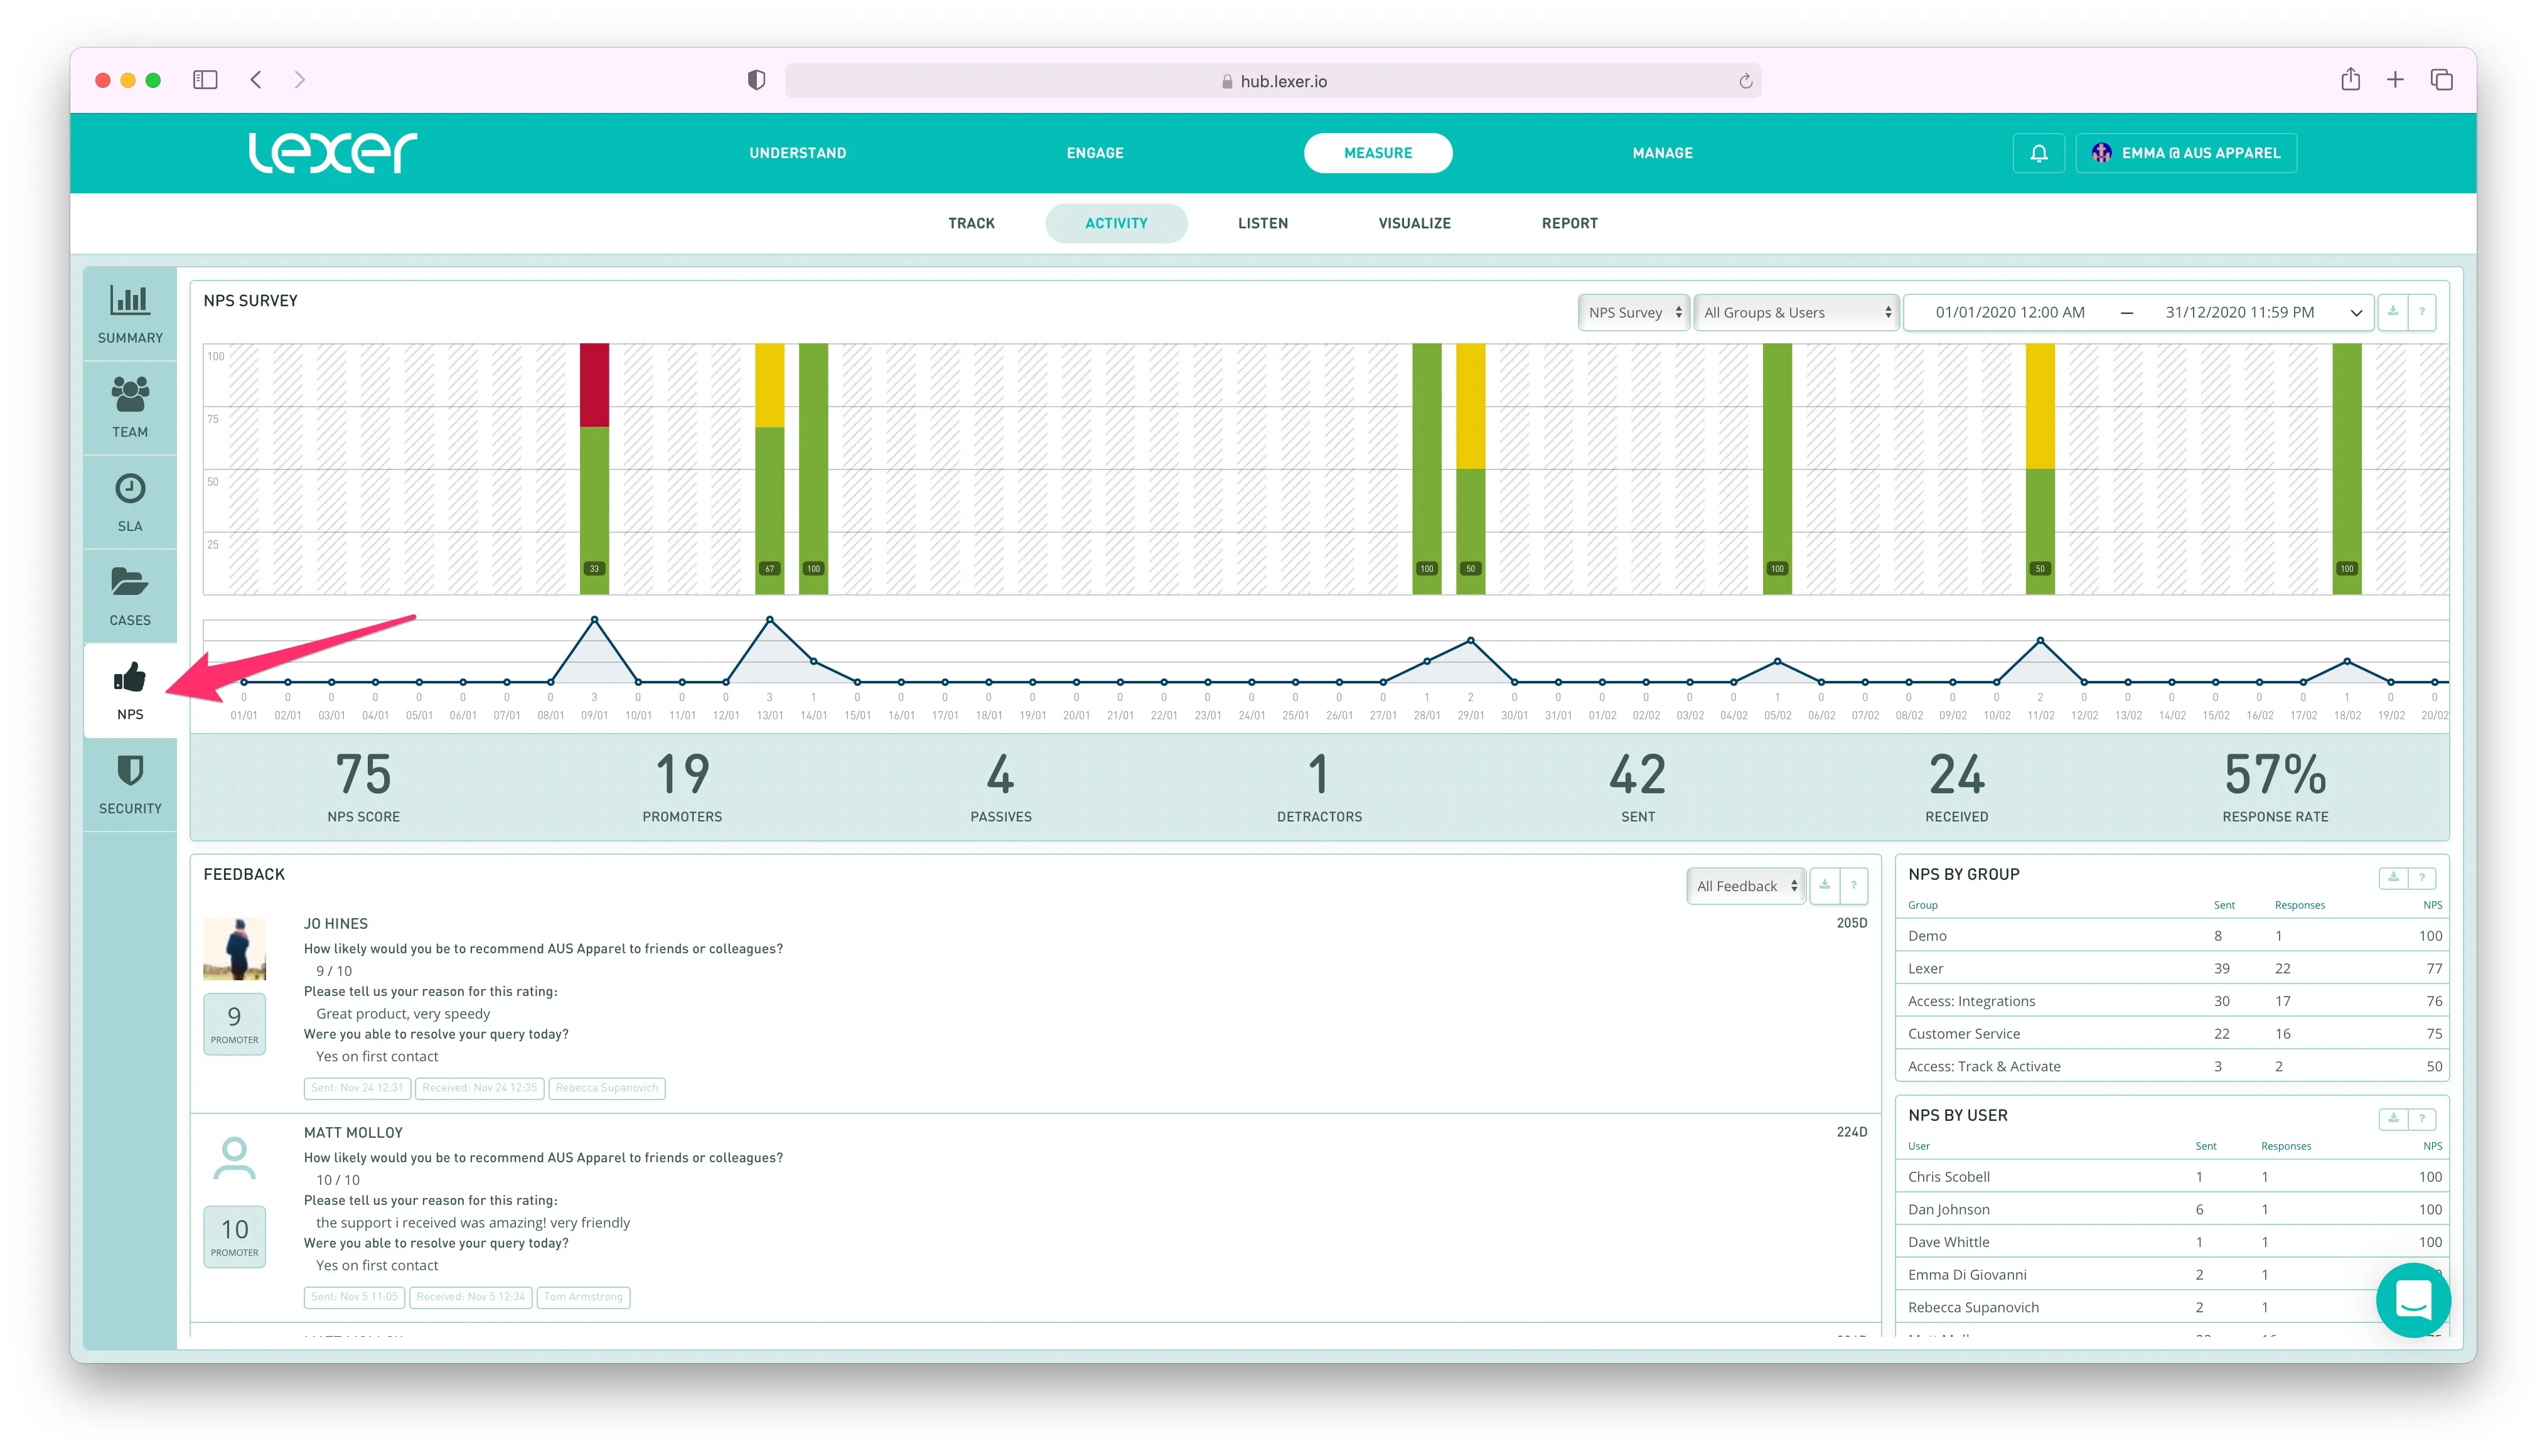
- NPS: See the outcome of Net Promoter Score surveys, and read into the responses from your own customers. Here you can see NPS scores by agents, read the conversations that gave these scores, and even respond to the customers involved in the engagement. The NPS report is the fastest way to learn about how the promoters and detractors feel about your service teams. Learn more about NPS here.
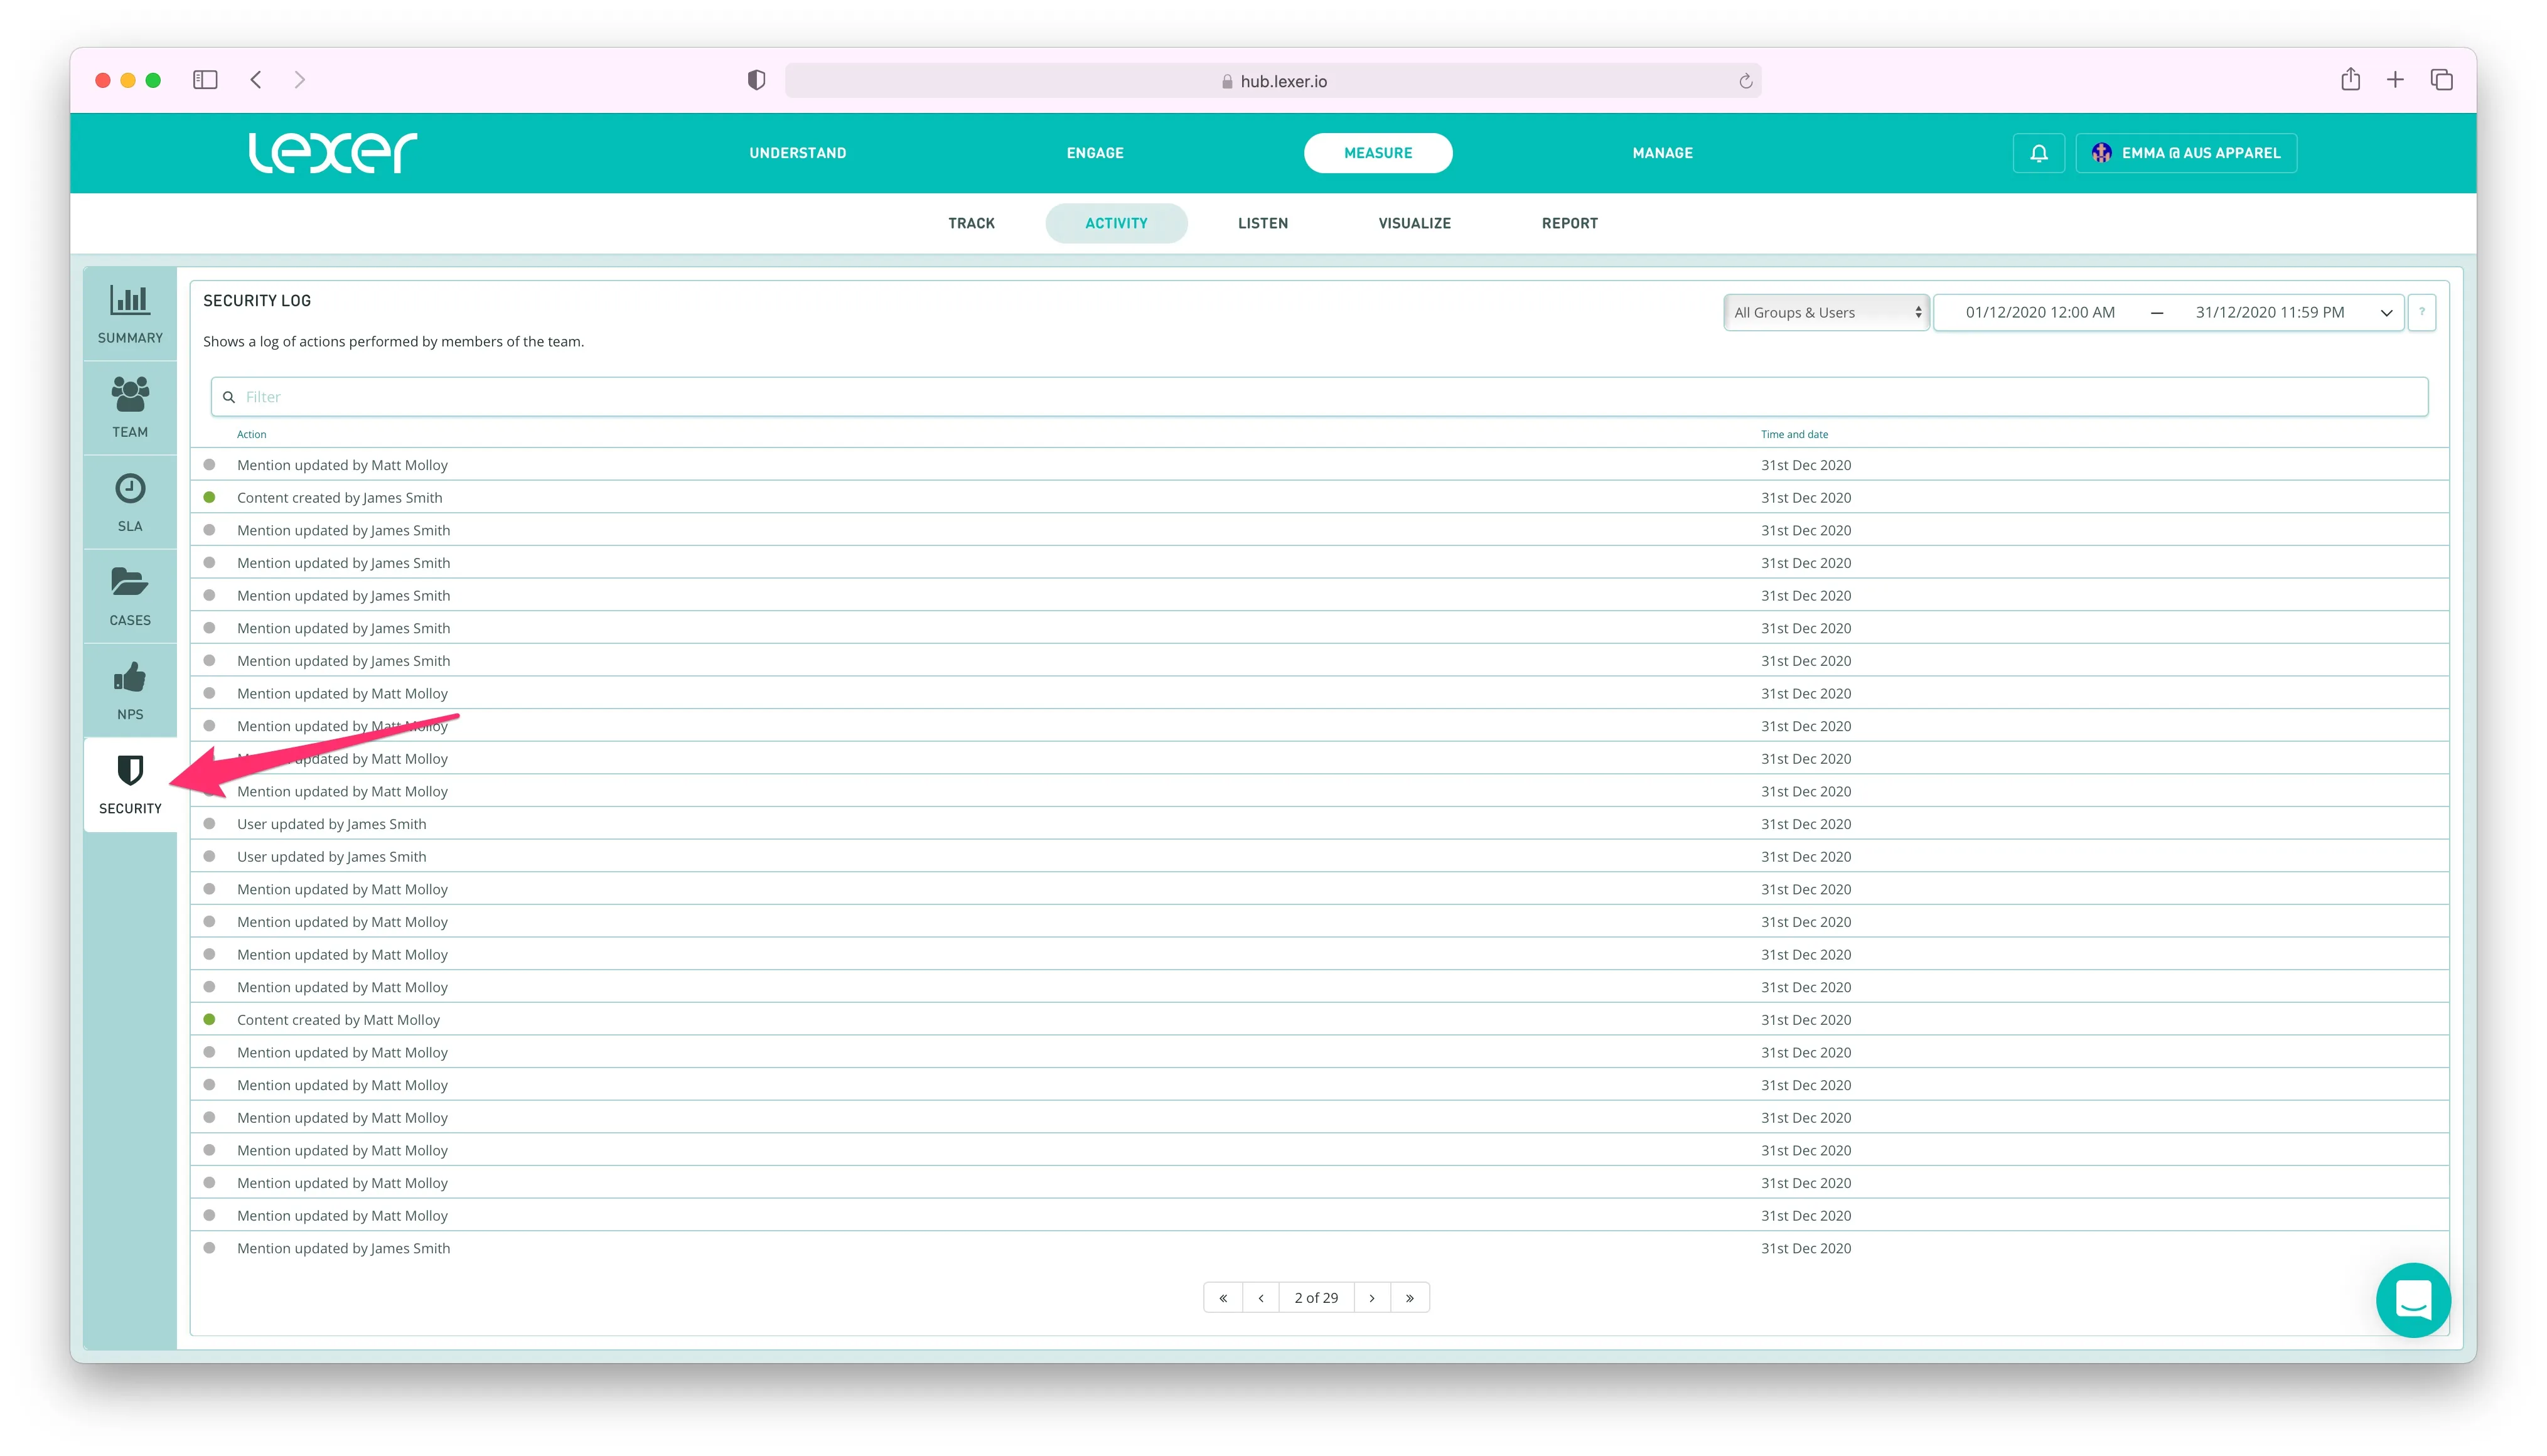
You can view a log of granular actions within the Lexer platform by heading into the Security report.
- Security: See the complete log of agent actions inside Lexer. Security is an ever present record of any submittable action in Lexer. Some examples are: activating audiences, responding to content, saving tier filters, filter security by teams, users and time. Read more about these actions, and what they mean here.
Reporting on the performance of your team with Activity
Customize your search
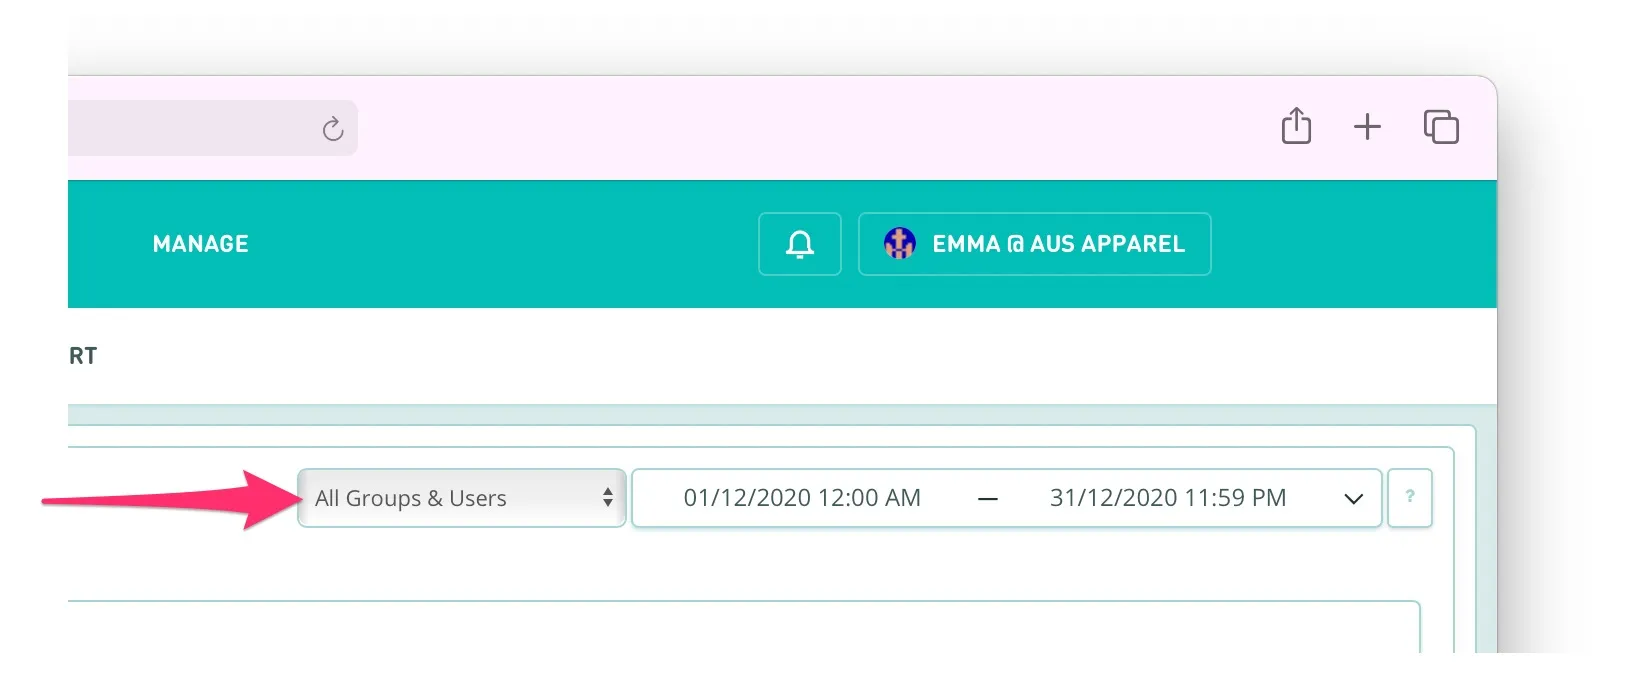
Across every report in Activity are two handy tools to help you customize your search. The tool with the default selection “All Groups & Users”, is where you can refine your summary to be about a specific user, or a group of users. Groups can be managed via Manage > Team > Our Groups.
The other selection tool is a date range picker. From left to right, select your start and finish date range, and time of day, to capture the most meaningful period, and help you understand where your team is at.
Instant Summary Statistics

On each report, you’ll be given a summary of the average for all results in your selected timeframe. While the metrics will change for each report, the format and layout is the same across all.
On the Summary report, you’ll see:
Explore your data in tables
On each report you’ll see a set of tables under the Summary stats, which give a more granular breakdown, and allow you to export for further analysis.
On the SLA and Cases reports, these tables are interactive - click on entries within the tables to open the objects they’re reporting on, and use them to respond to customers, leave notes for your team, and apply Classifications etc. as you would in Engage.
Export data
Every table in Activity has an export button in the top right hand corner, which allows you to download its data in csv format. Note that exports from tables with large amounts of data may take a few moments.
