Getting started with Logs
Lexer's Logs feature gives you complete visibility into how your customer data flows through the CDP. Whether you're monitoring routine data imports or troubleshooting specific issues, Logs provides a clear timeline of every data job - from initial file uploads through to final processing. You can quickly verify successful data loads, identify potential issues, and ensure your customer data is being processed correctly. This guide will show you how to use Logs effectively to monitor and maintain the health of your customer data.
Understanding data processing
When data enters the Lexer CDP, it flows through a sequence of six essential processing stages. Understanding this order helps you track your data's progress and quickly identify where any issues might occur.
Let's examine each stage:
- Integration or File Upload: The initial entry point for your data, whether through an automated integration (like Shopify or Klaviyo) or a manual file upload.
- Dataset Load: Your incoming data is loaded into a dataset, preparing it for processing within the CDP.
- Dataset Health Check: Automated checks verify data quality, focusing on:
- Data volume consistency
- Record recency
- Identifying any rejected records
- Identity Resolution: Customer records are matched and merged across your datasets, creating a unified customer profile based on your identity resolution rules.
- Dataflow: Your data undergoes enrichment and organization processes, transforming it into Hub-ready format and standardizing attributes.
- Build Index: The final stage where your data is indexed for use throughout the Hub's interface, enabling segmentation and analysis.
Note: Not every data upload will trigger all six stages. The specific jobs that run depend on your data source and upload method.
Using the Logs interface
The Logs interface gives you a comprehensive view of all data processing activity in your CDP. Here's how to navigate and understand the main components.
Main Components
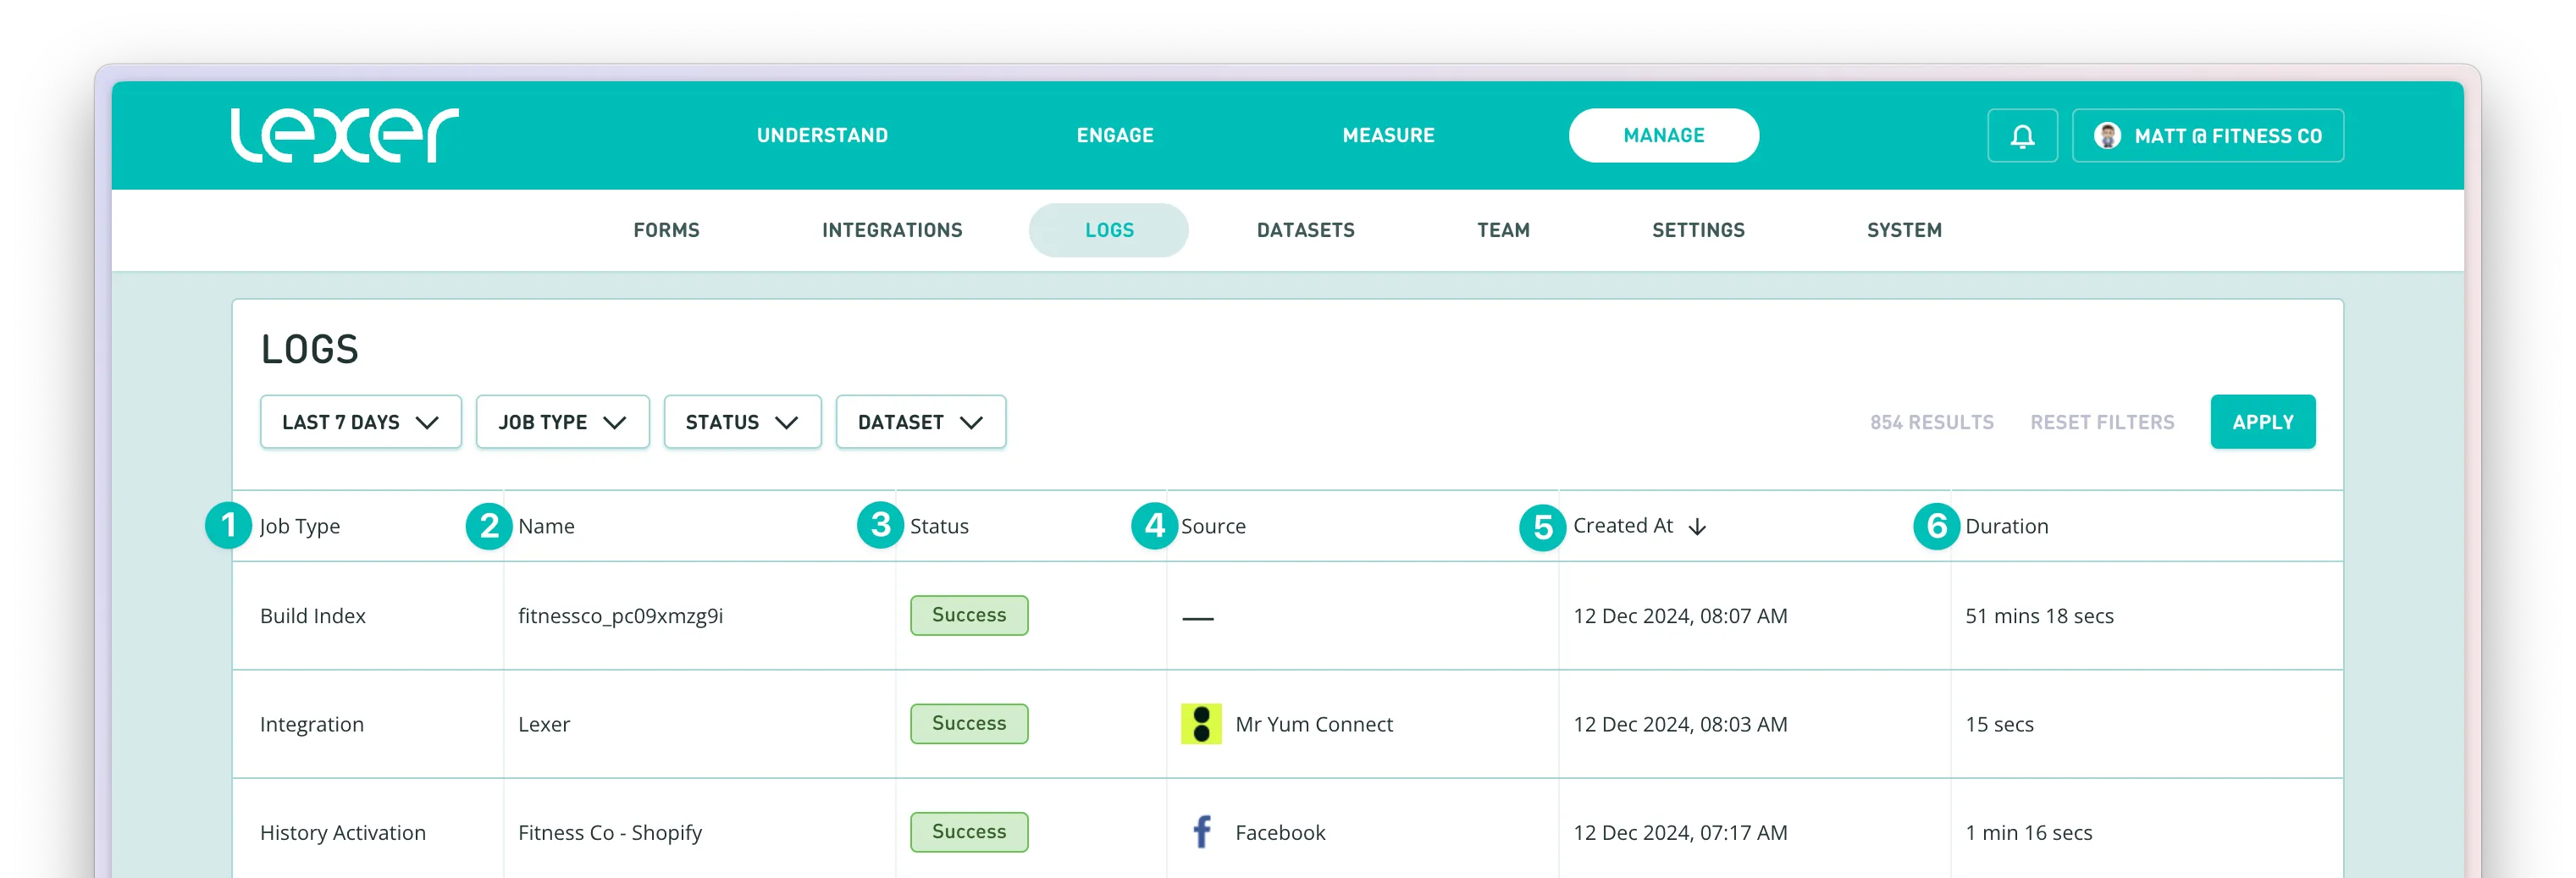
Each log entry displays six key pieces of information:
- Job Type - The specific process being performed, such as:
- Integration Job
- File Upload
- Dataset Load Job
- Identity Resolution
- Dataflow Job
- Build Index
- History Activation
- Delete Dataset Job
- Activations
- Name - The identifier for the specific job
- Status - The current state of the job:
- Success: Job completed successfully
- Failed: Job encountered an error
- Pending: Job is queued to start
- In Progress: Job is currently running
- Source - Where the data originated from
- Created at - When the job started
- Duration - How long the job took to complete

Filtering
To help you find specific logs quickly, use the filtering options at the top of the page:
- Date Range - Default is Last 7 Days, but you can select any custom period
- Job Type - Filter for specific types of jobs
- Status - Focus on specific job statuses (e.g., only Failed jobs)
- Dataset - Filter by specific dataset (shown as datasetID - datasetname)
You can sort any column by clicking its header - an arrow will indicate ascending or descending order.
Viewing job details
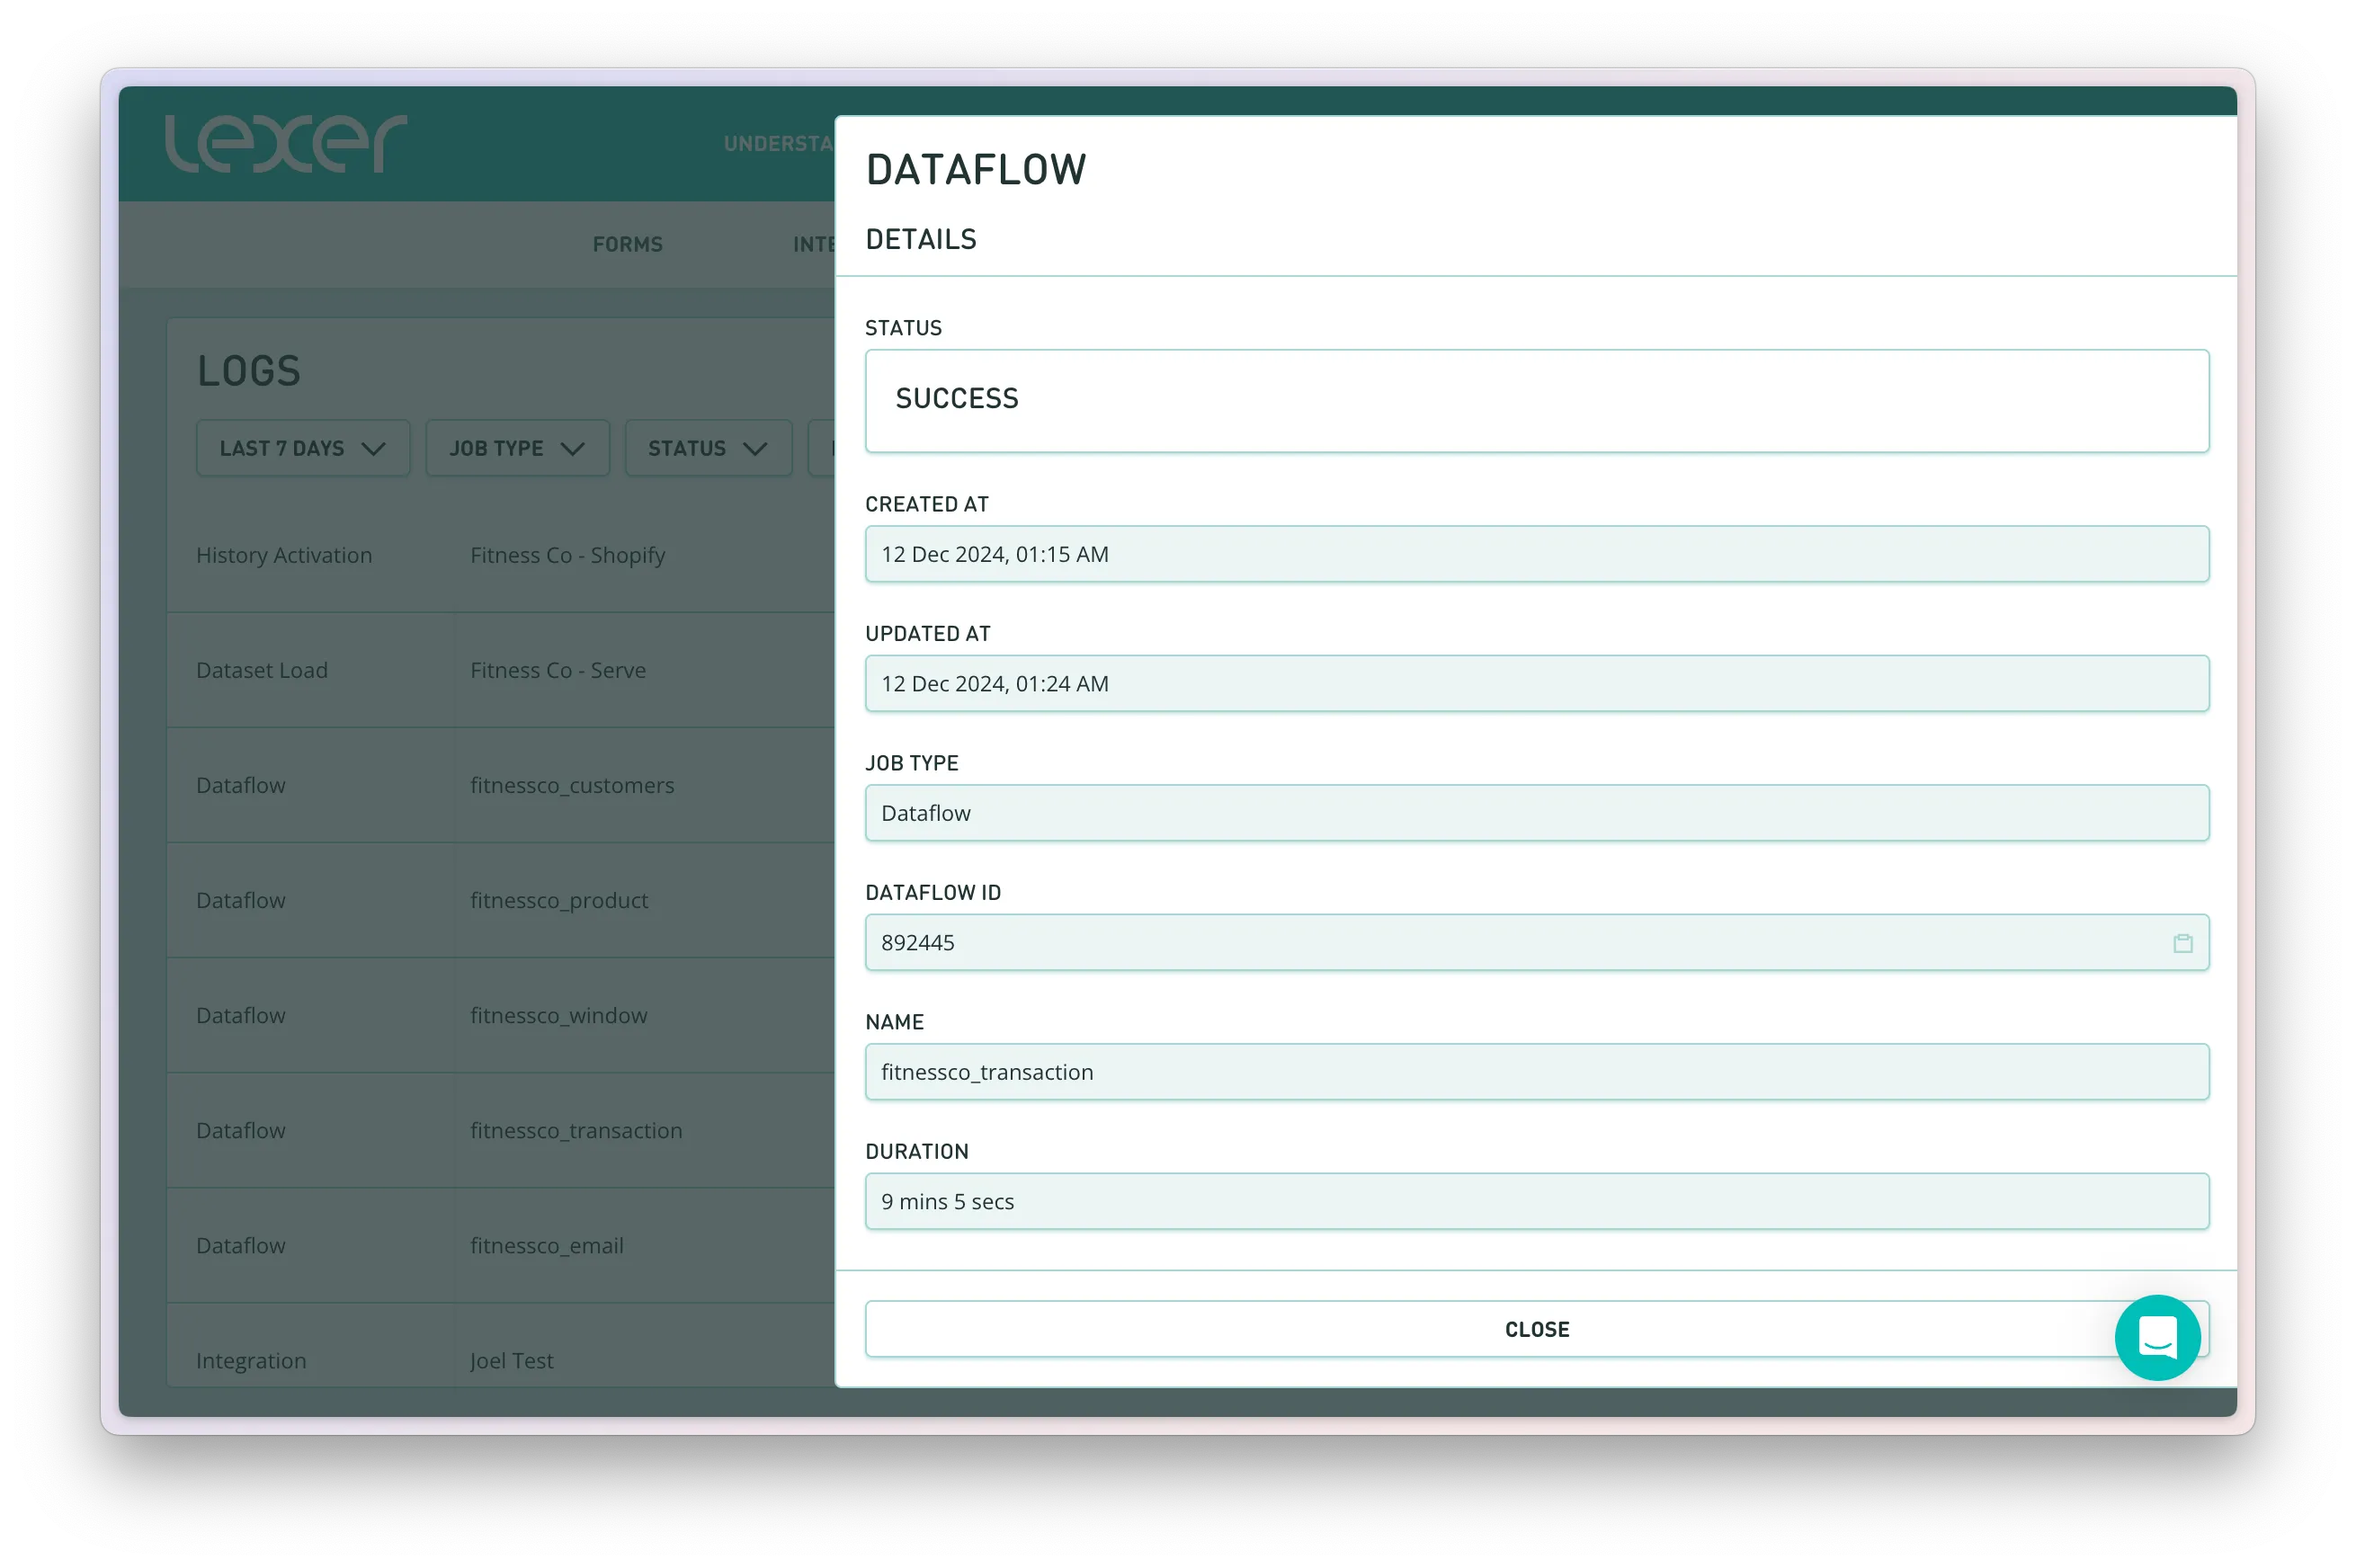
Click on any log entry to see detailed information about that job, including:
- Complete job metadata
- Specific timestamps
- Job-specific details (varies by job type)
- For integrations: Provider and pipeline type information

Pro Tip: When working with support, you can share the exact job you're looking at by copying the URL from the job details view.
Job Types Explained
Health checking your data
Regular monitoring of your Logs helps ensure your data is processing correctly. Here are key areas to monitor:
Daily Data Loads
- Check that scheduled integrations are running successfully
- Verify expected data volumes are being processed
- Confirm processing times are within normal ranges
Investigating Issues
When you notice potential issues, you can:
- Use date filters to identify when the problem started
- Filter by job type to isolate specific parts of the process
- Look for any failed jobs in the sequence
- Check job durations for unusual processing times
Working with Support
Need help investigating an issue?
- Copy the job's URL directly from your browser
- Share this URL with your Success Manager or Support team
- This gives them immediate access to the specific job details
- Speeds up investigation and resolution time
Summary
The Logs interface is your central tool for monitoring data health in Lexer. From tracking data processing to troubleshooting issues, understanding how to use Logs effectively ensures your customer data stays accurate and up-to-date. Remember these key points:
- Monitor your data processing through the six stages: from upload through to build index
- Use filters to quickly find specific jobs or investigate issues
- Share job URLs with Support for faster problem resolution
- Make regular health checks part of your data management routine

