Welcome offer strategies: Using the Hub for analysis
Using welcome offers, such as discounts for first-time purchasers, is a great way to entice new customers and incentivize their first purchase. But, how do you know if these strategies have a good ROI? And what do these “welcome offer” customers look like, compared to new customers who don’t purchase using a welcome offer? Do they have a higher, or a lower, lifetime value for example?
In this article, we’ll walk through how to use the Lexer Hub for welcome offer analysis, with a few tips and tricks along the way!
New here? Take $10 off your first purchase!
Let’s start at the beginning with customer acquisition.
Lexer has an out-of-the-box segment called Top 10% Active: Use for lookalike audiences in paid, which you can use to activate to your paid channels, such as Facebook or Google Ads. The algorithms in paid channels are very good at finding audiences that look like your existing and best customers, so it’s really the ultimate strategy for maximising your paid media budget.
Simply create a new activation, select the channel you wish to activate to, and then select this segment.
For a refresher on how to use Lexer’s activate tool, click here.
To find out how to activate to specific channels, we have our integrations articles here.
You can then use your campaign creative for your welcome offer. In this example, we’re going to offer all first-time purchasers a $10 discount.
Creating your welcome offer segment
Once you’ve sent your welcome offer campaign, you need to start tracking the segment of new customers who then go on to make a purchase using the discount.
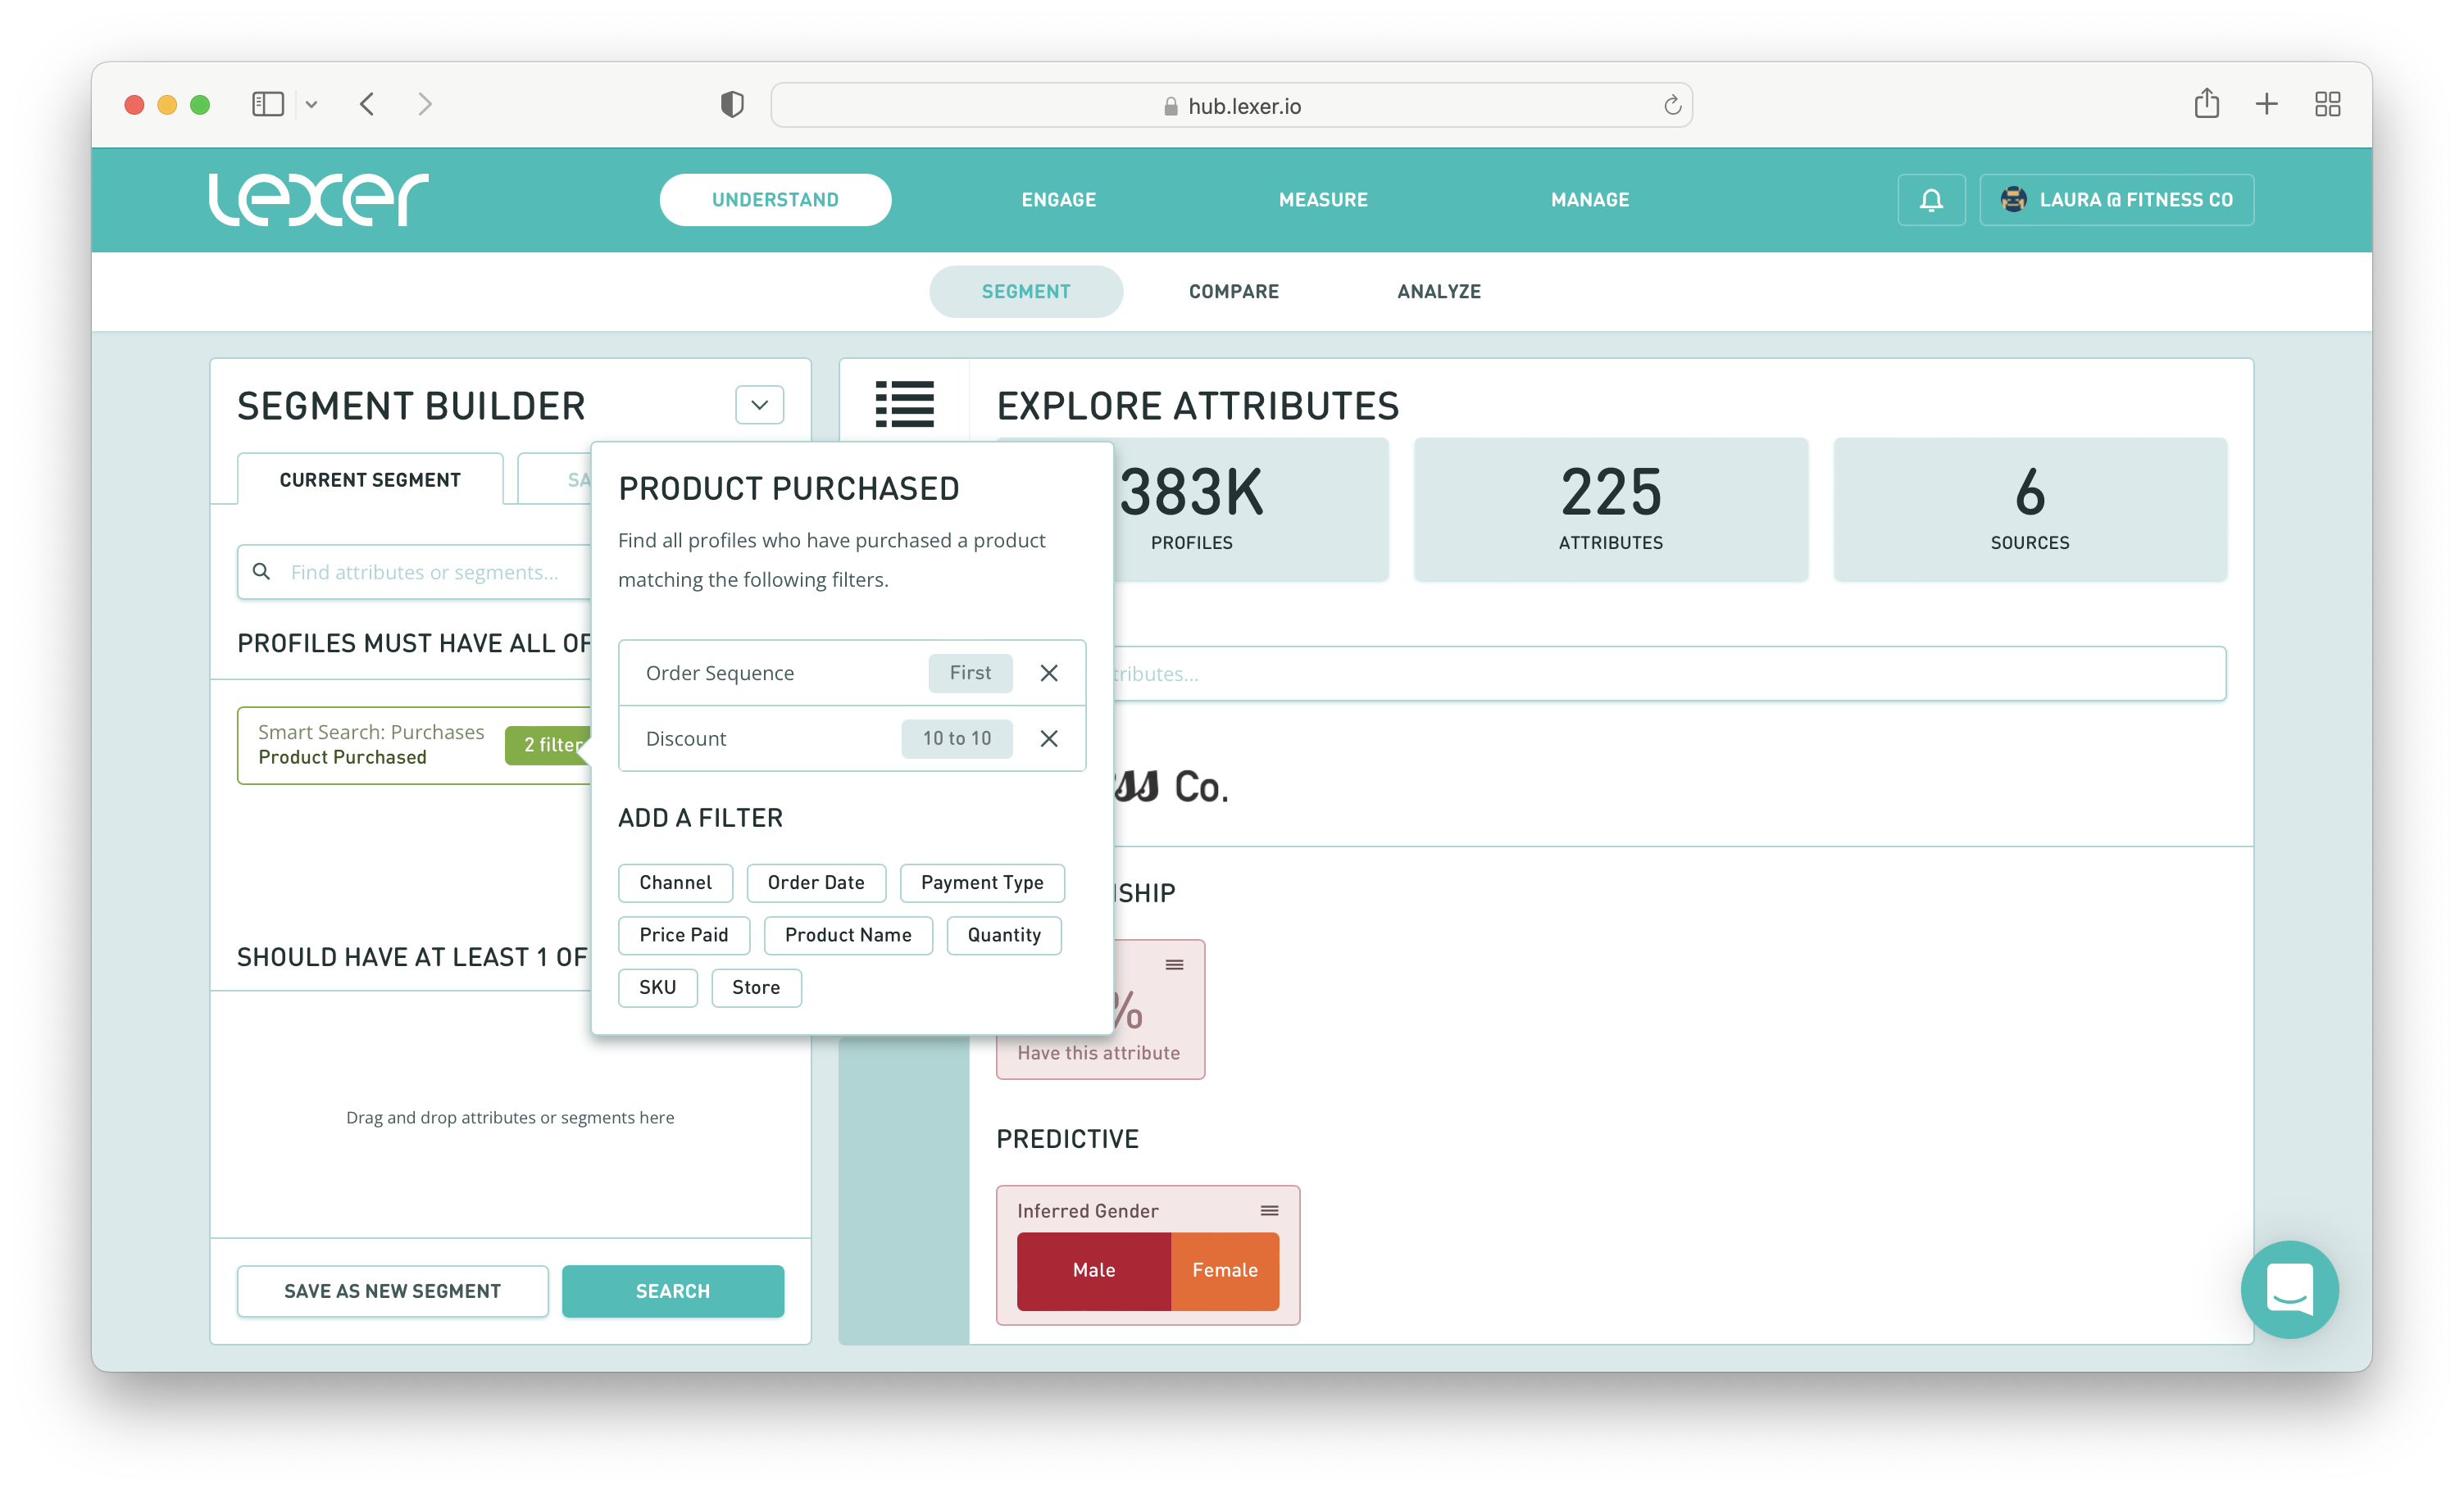
To do so, navigate to Understand > Segment, and you can use your Smart Search attributes for this example. In the Segment Builder add the Product Purchased Smart Search attribute to the PROFILES MUST HAVE ALL OF THESE section of the builder, and then add the following filters:
- Order Sequence > In the FIRST order
- Discount > Between > $10 - $10

What this query is searching for is all customers who have used a $10 discount on their first purchase.
You can then Save this segment, and because Lexer segments are dynamic, anyone who meets these parameters in future will automatically be added to the segment and it will grow over time.
For a refresher on how to create and save new segments, click here.
First-time buyers who didn’t use a discount?
It’s also handy to be able to compare your first-time buyers who purchased using your welcome offer discount, against those who didn’t.
Why is it handy? Because you can see which customers have a higher lifetime value, which will inform your acquisition strategies in the future.
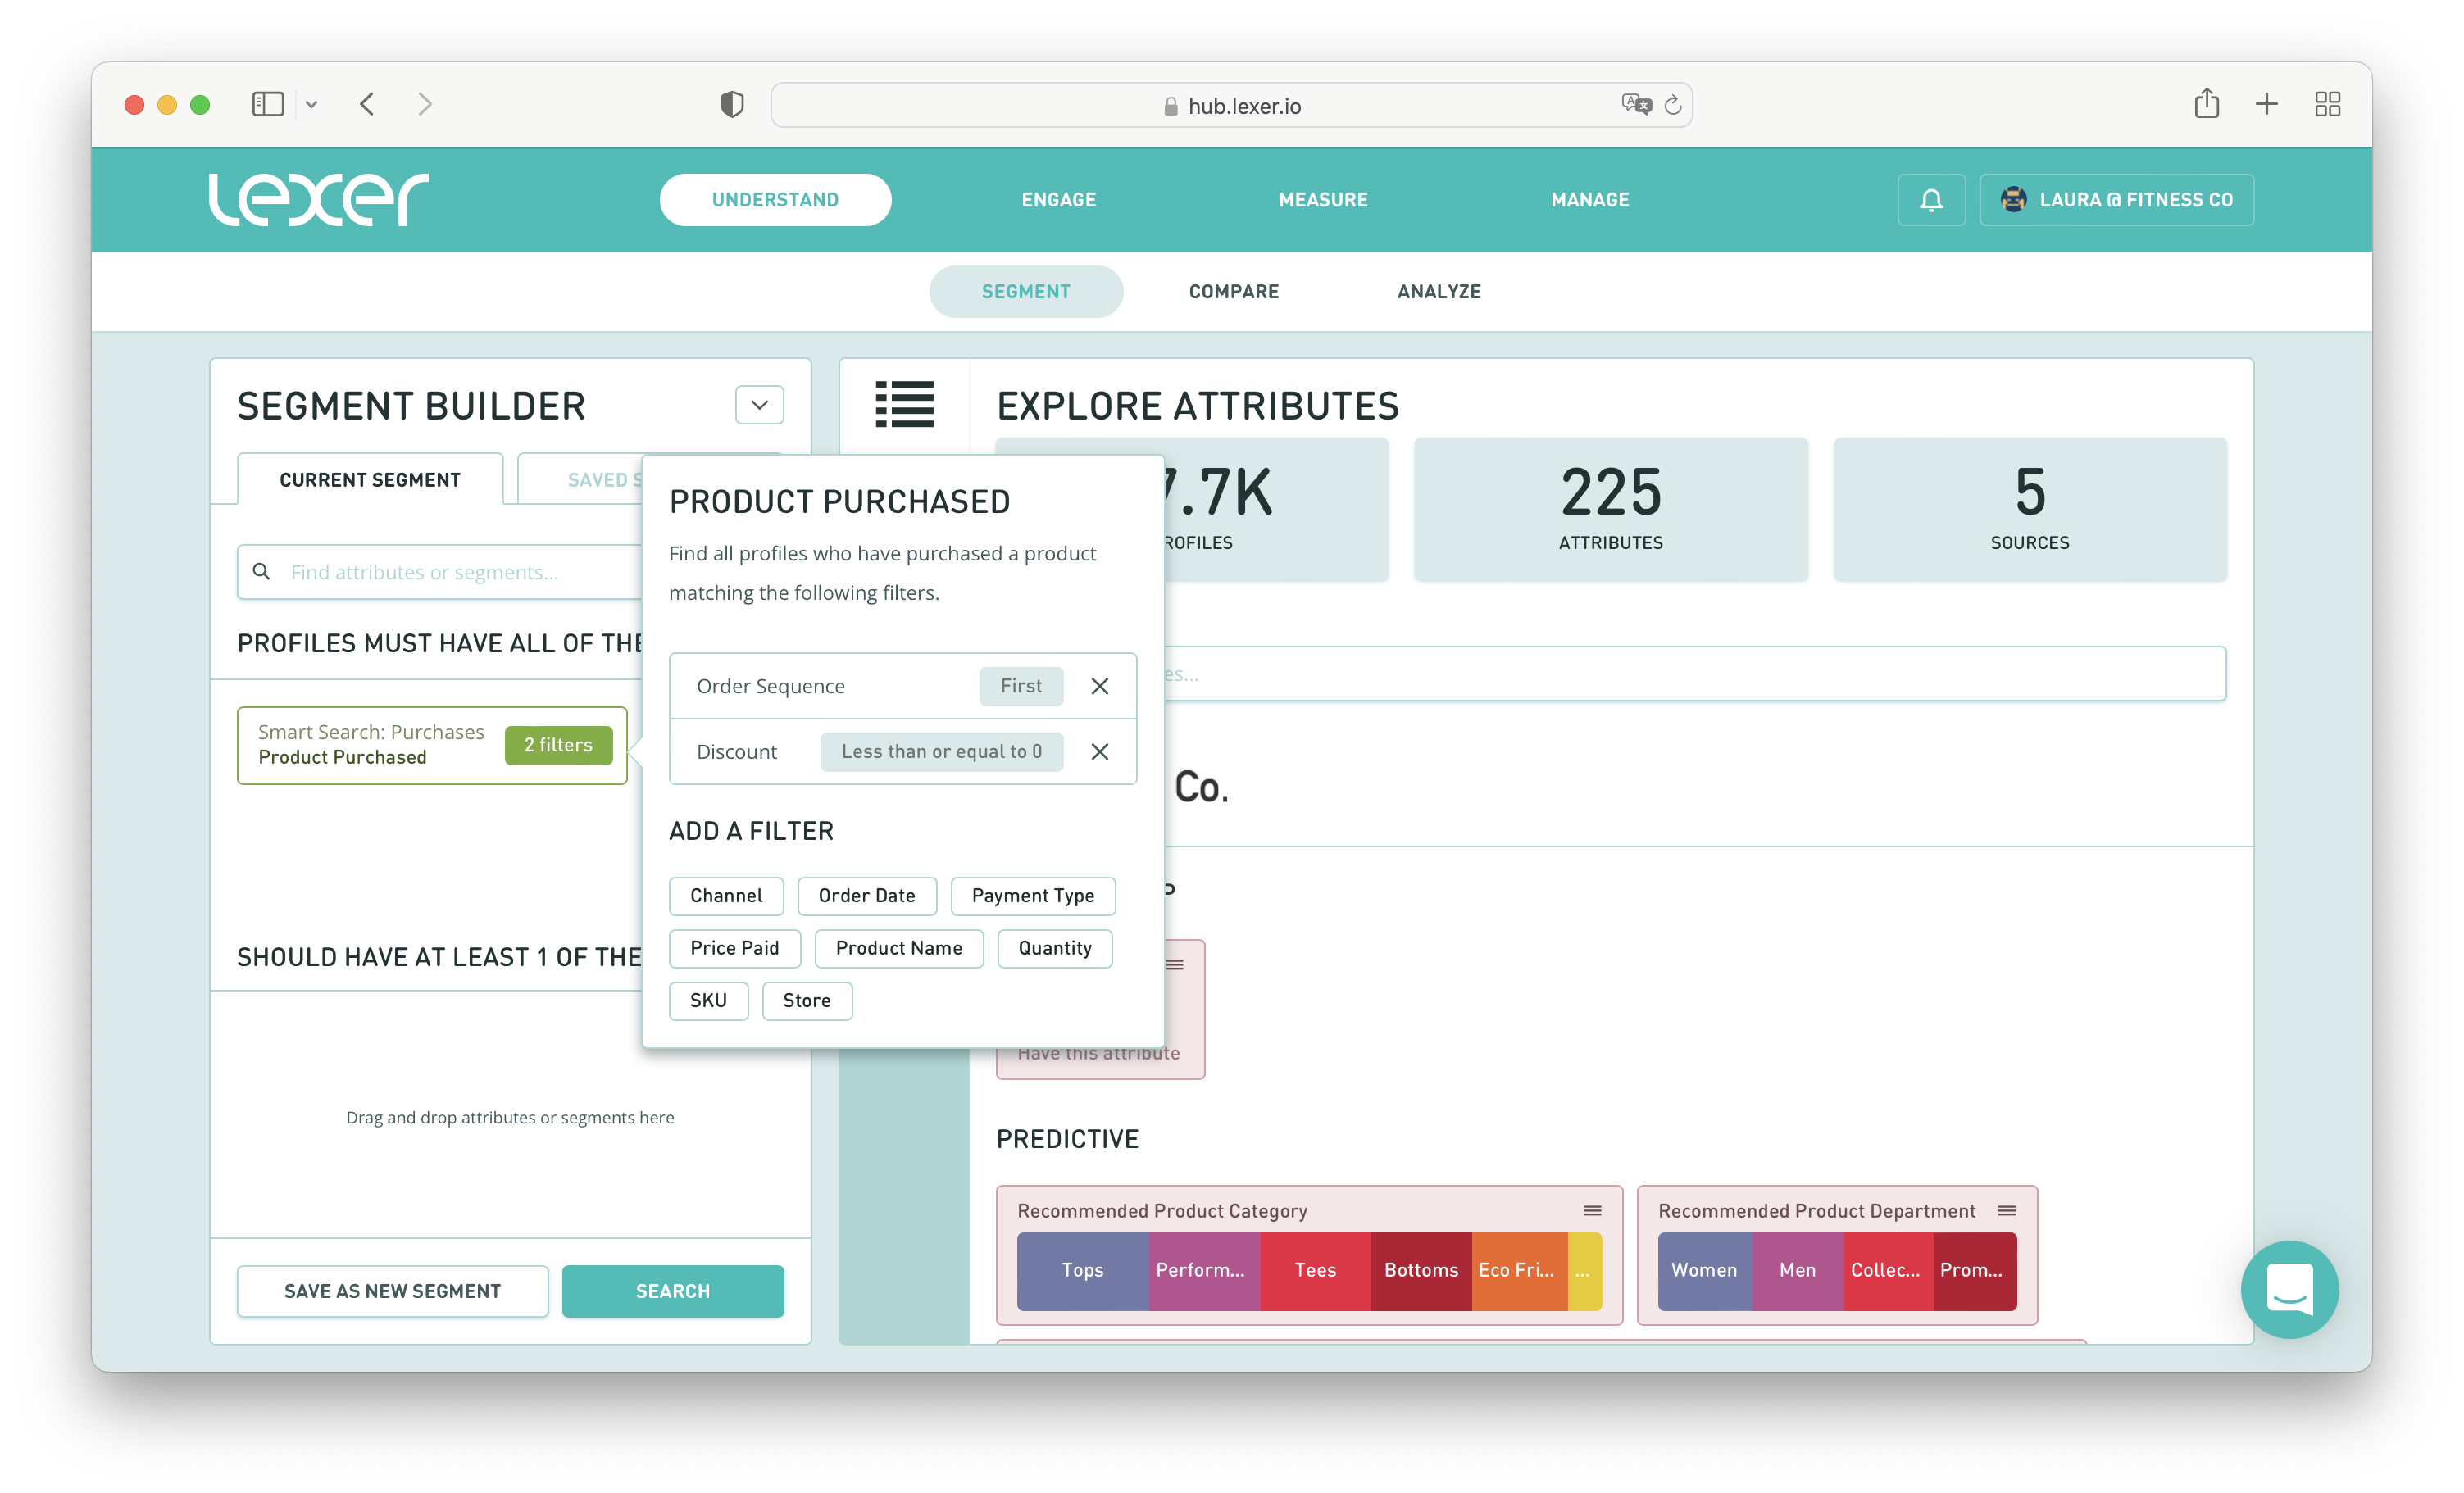
Creating this segment is very similar to our discount purchasers, but with one key difference. You use the Smart Search Product Purchased attribute again and add it to the PROFILES MUST HAVE ALL OF THESE section of the builder, and then add the following filters:
- Order sequence > In the FIRST order
- Discount > Less than or equal to > 0

What this query is searching for is all customers who did not use a discount of any kind on their first purchase.
You can then Save this segment, and you’re ready for some analysis.
Setting up your metrics
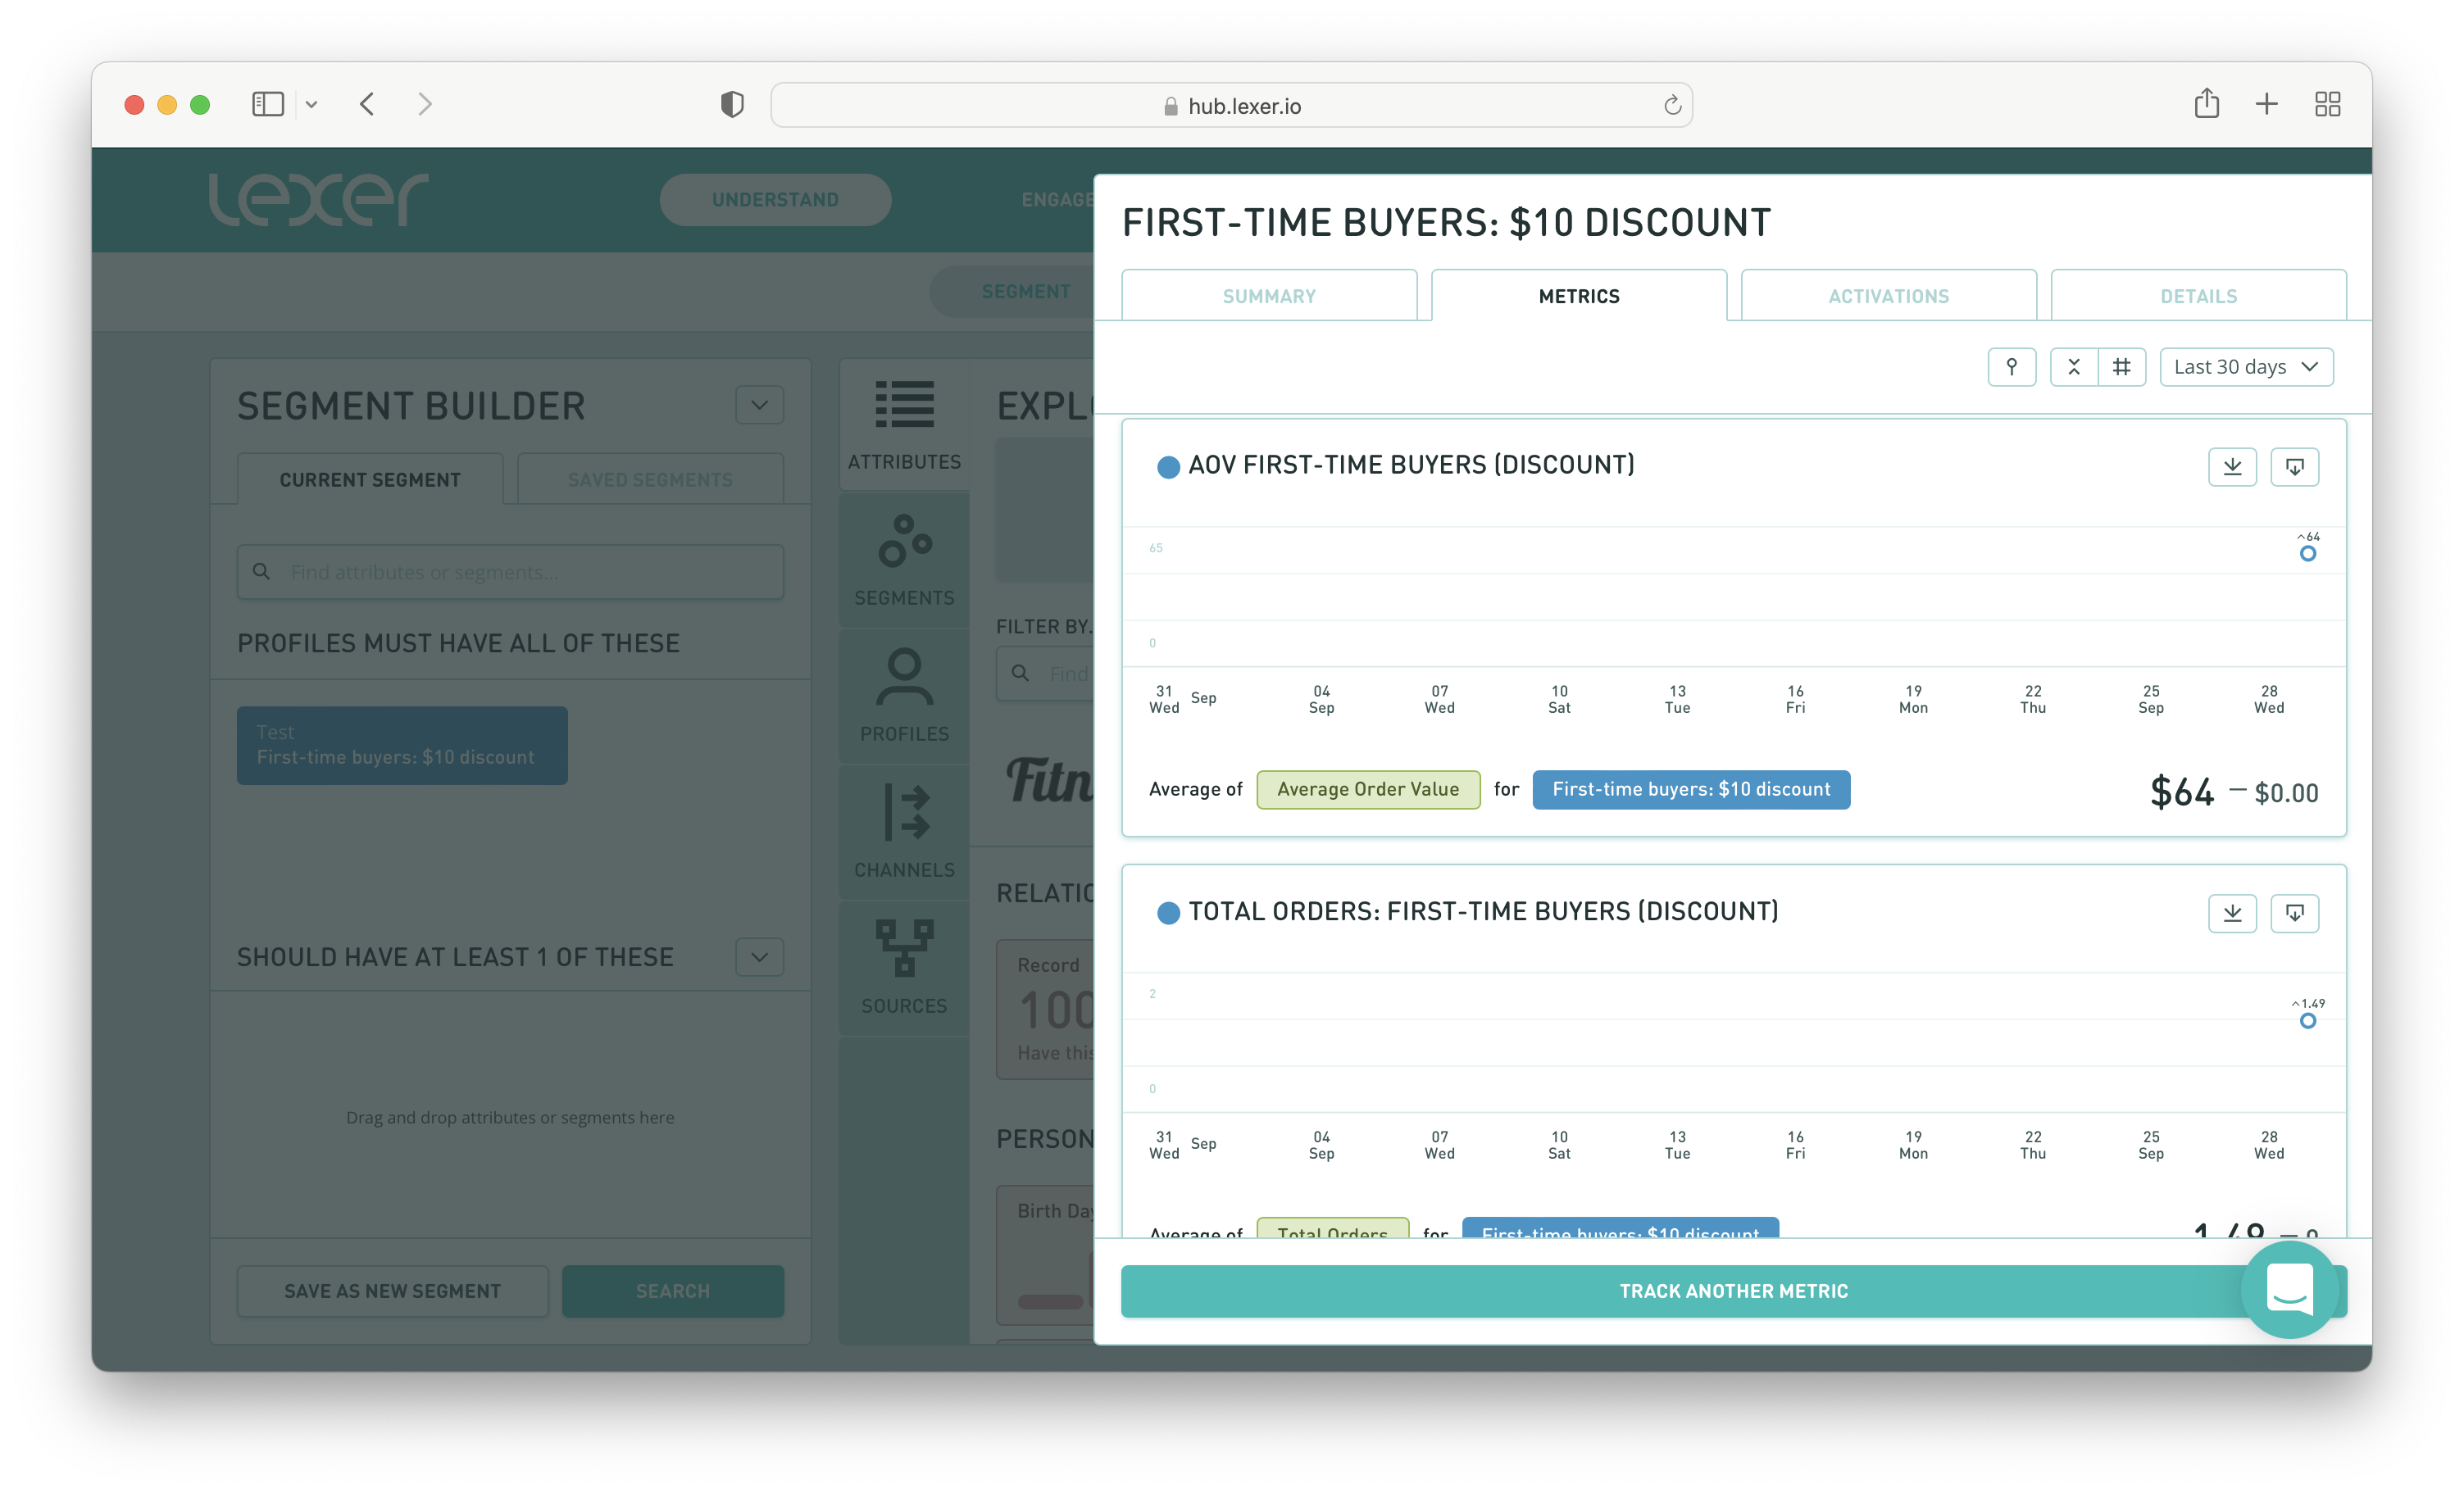
Now that you have your segments saved, you can create the metrics you would like to track against these segments.
For example, you may like to create metrics for:
- Average order value
- Total orders
- Total spend
But feel free to add to this list!

For a refresher on how to create metrics, we have this handy video.
Tracking your first-time buyer segments
Now that you have your two segments saved, you can use Track to see how they grow over time, but you can also use this tool to gather insights into the type of customers who make up these two segments, and whether one is more valuable than the other.
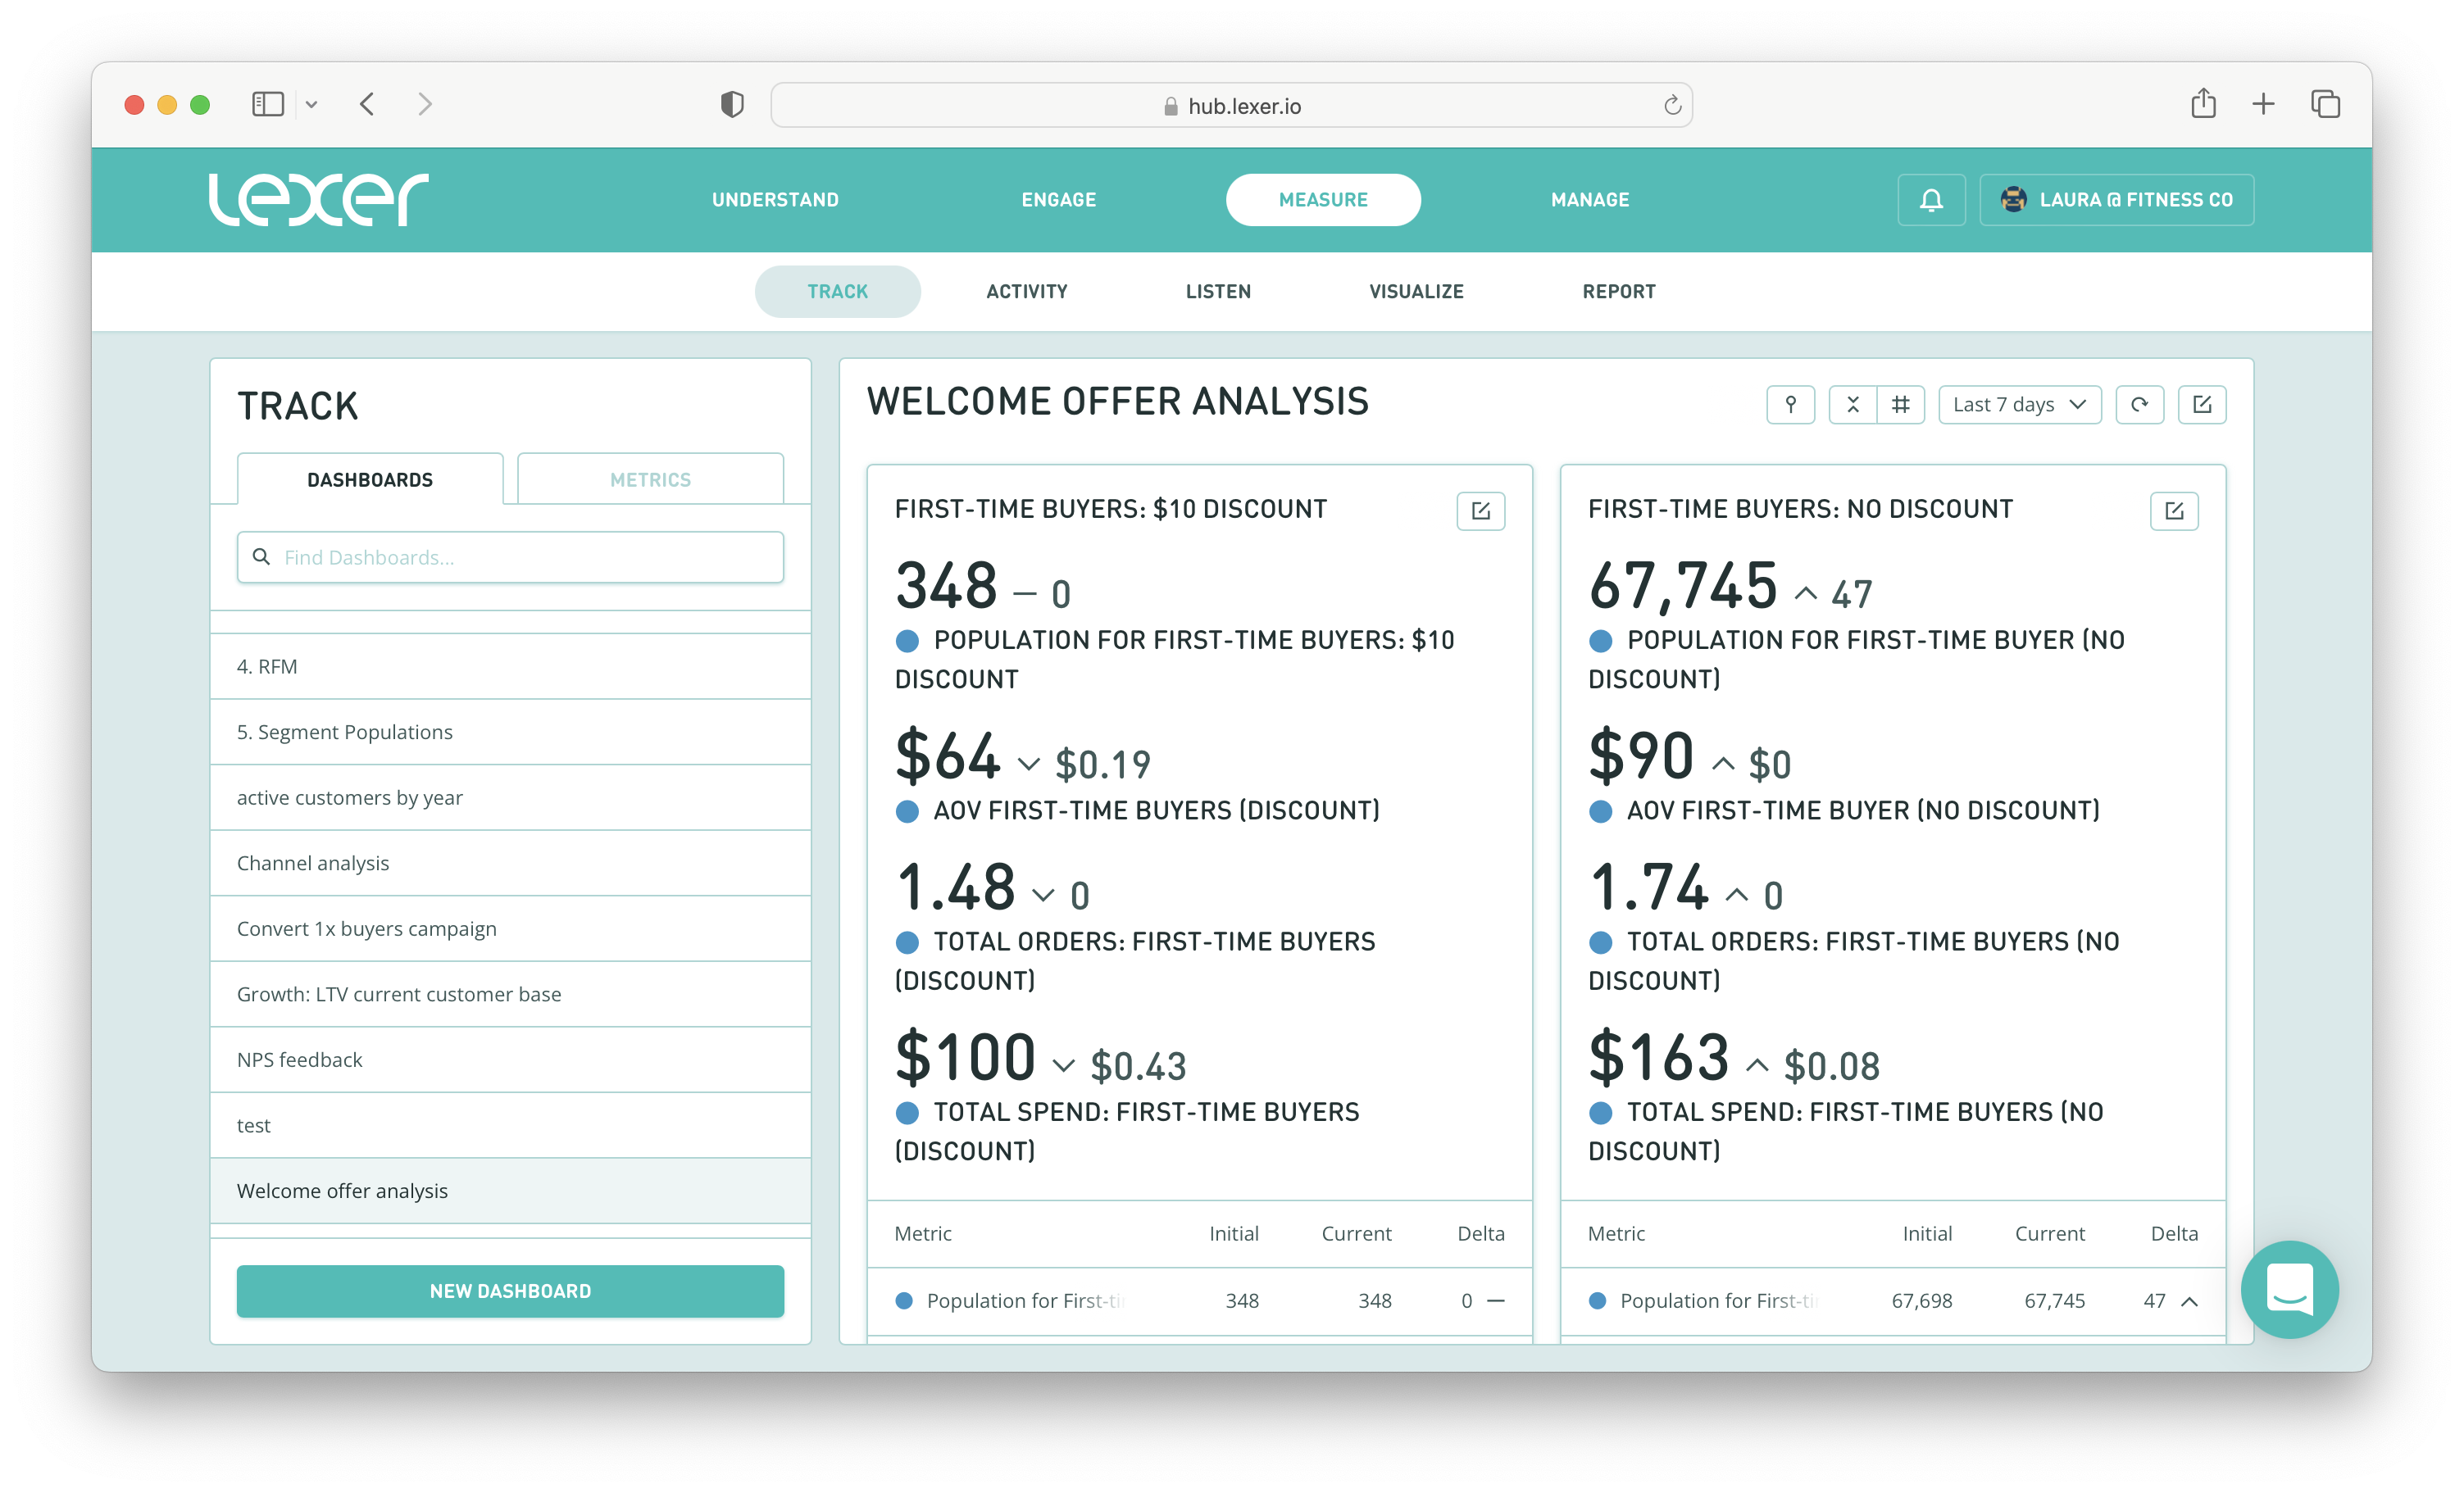
To do so, navigate to Measure > Track and create a new dashboard. You can call your dashboard something like Welcome offer analysis, or something similar.
You can then start to add your metrics.
Firstly, find the metrics attached to your First-time buyer: Discount segment (including the population metric) and add them all to the same card.
Then do the same for your First-time buyer: No discount segment. Make sure that both cards are side-by-side.

If you’d like a refresher on how to add metrics to your dashboards, and how to display them, check out the same handy video linked above.
Running your analysis
Once your dashboard is complete, you can compare one card’s metrics against the other.
Some questions you can ask yourself include:
- Is the population for my welcome offer users growing? And what does this mean for your return on investment?
- Which segment has the higher lifetime value? For example, does your welcome offer segment have higher or lower total orders than your non-discount users? Or a higher/lower average order value, or total spend?
- If your discount segment has a lower lifetime value than your non-discount segment, what does this mean for your welcome offer strategy?
Having this dashboard configured means you have an up-to-date look into your welcome offer strategies and how they’re performing over time.
If you have any questions as you get started, please reach out to your Success Manager, or Lexer Support.

