
Contact Reporting
Contact reports act as a powerful complement to the Lexer Contact, offering comprehensive insights into customer interactions and engagement with your Contact messages. They allow for analysis of all messages sent through Contact, allowing you to assess the effectiveness of your marketing campaigns and customer outreach efforts using practical measures of success.
Contact reports
There are currently two different reports available for Contact with more in the works.
- Overview - Provides a great snapshot of the impact of Contact.
- Team engagement - Offers an overview of the work your team has done in Contact.
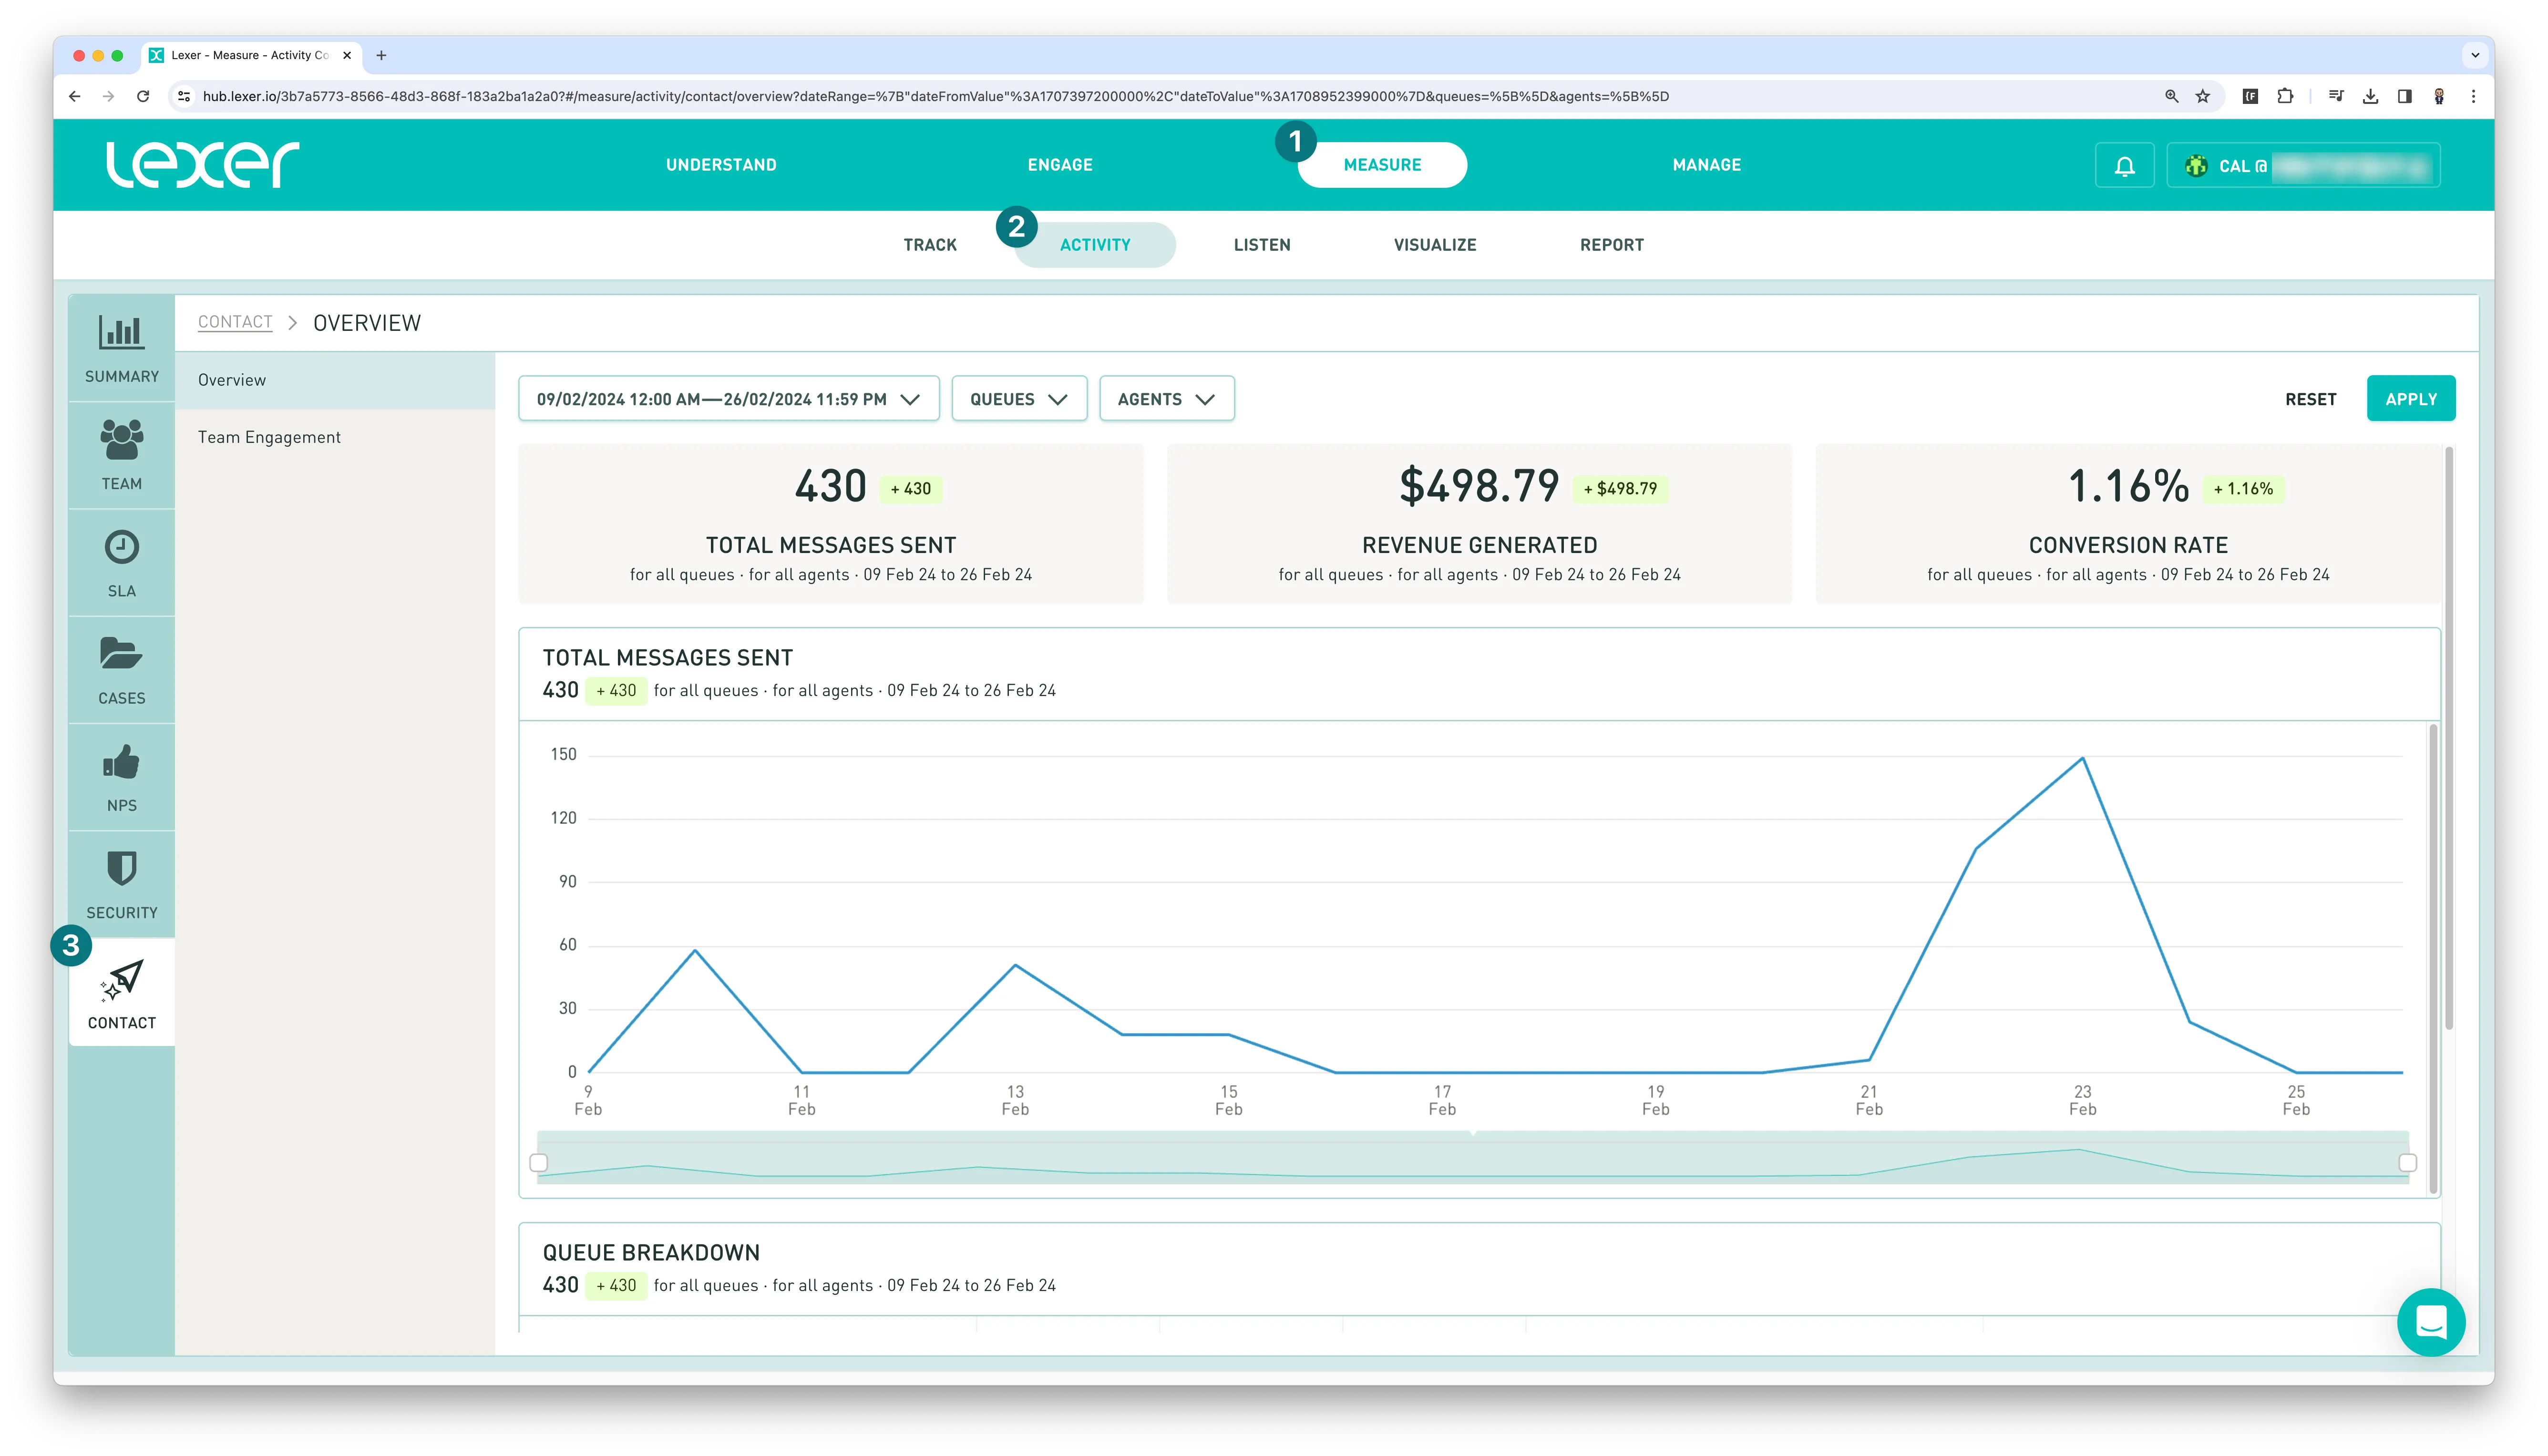
Contact reports are located in Measure > Activity > Contact.
Access and permissions
Visibility depends on group permissions in the Hub. Users need "Can manage Contact?" permissions (typically via the Contact: Manager group) to access Contact reports. For more information about permissions, you can check out our Group Permissions Learn article.
Filtering results
The filters at the top of the tab allow you to adjust the output based on:
- Date range (which defaults to last 30 days) - this allows you to adjust the reporting period.
- Queues - filter to include some or all queues.
- Agents - filter to include some or all agents responsible for the interaction.
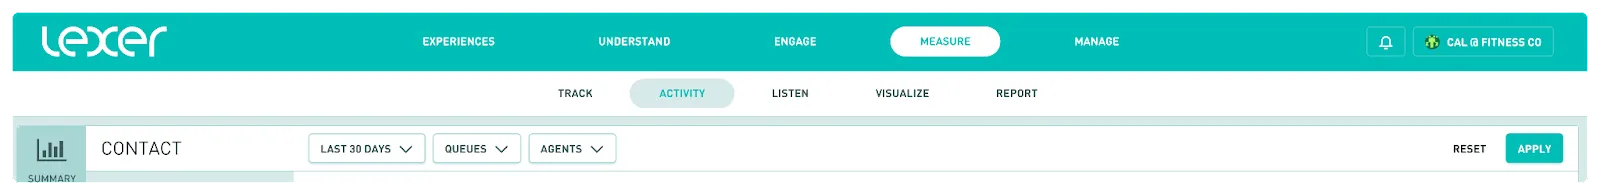
Adjust these filters by using the drop down to select the variables you want to include in your search and click “Apply” on the right side of the page.
Overview tab
The overview tab is a dashboard that helps highlight important stats related to the success of Contact in your Hub. Learn how heavily Contact is being used and how much revenue is being generated from it.
Let’s take a look at the different metrics available:
Hero metrics:
- Total Messages Sent - The total number of messages sent to customers in the reporting period. Skipped messages do not count towards this metric (and are reported in the breakdown table below).
- Revenue Generated - The total sum of the order values for customers who were sent a contact message and made a purchase within 7 or 30 days of receiving their message. Includes both in store and online orders.
- Conversion Rate - The percentage of customers who were sent a Contact message and made any purchase within the next 7 or 30 days (based on your attribution window filter). This includes both purchases in store and online. For example, if we sent 100 messages in the reporting period and 20 of those customers made a purchase in the 7 days following each of their messages, the conversion value would be 20%.
Detailed breakdown:
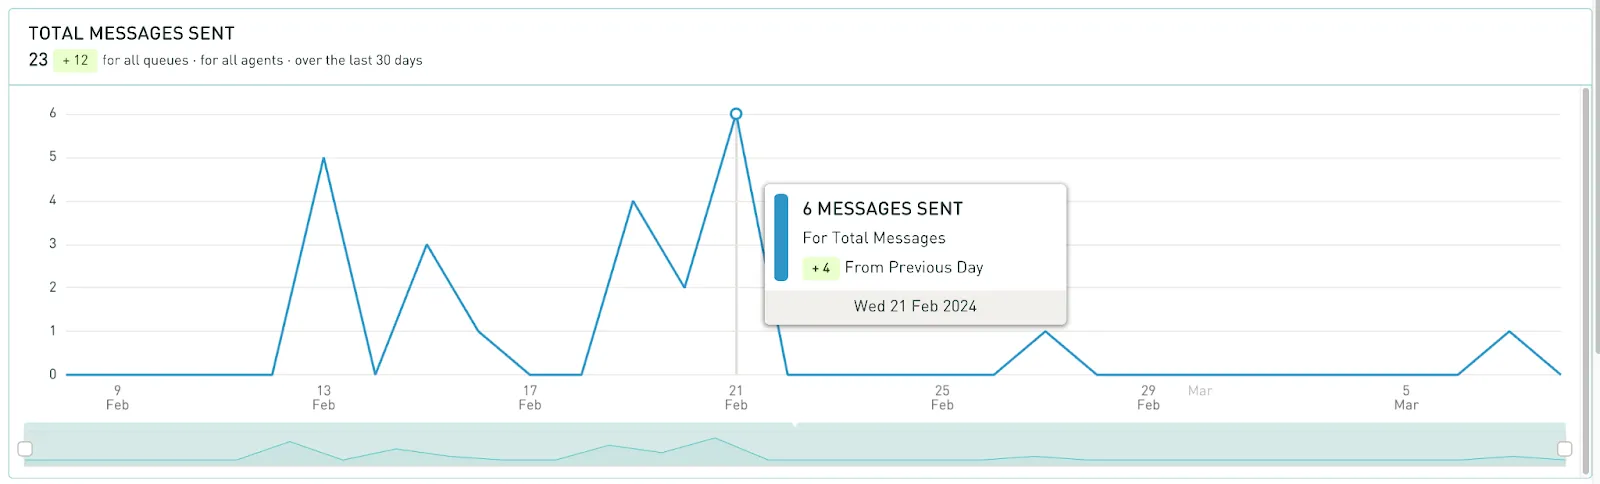
- Total messages sent - A view of total messages sent over time. This can be used to dive deeper into when the messages were sent. Hover over a particular day to view a tooltip that shows the detail for that day.
- Queue Breakdown - This metric provides key statistics that highlight the success of each queue that has been created in Contact. This table presents a row for each queue with at least one message sent in the reporting period. See what’s working and how well its working using the following metrics: some text
- Messages sent
- Messages skipped
- Revenue generated
- Revenue per message
Team engagement tab
Check in on your teams in store performance using the team engagement dashboard.
Let’s take a look at the different metrics available:
Hero metrics:
- Active users - Calculated as the distinct number of team members with activity in this reporting period. A team member will measure activity if they send at least 1 message in any queue.
- Revenue per message - Calculated by dividing the Revenue Generated value by the Total Messages Sent value. For example, if we generated $1000 in revenue from 100 messages, then our revenue per message would be $10.
Detailed breakdown:
- Total messages sent - Again, this shows a view of total messages sent over time however this breaks this down per team member. This can be used to dive deeper into when the messages were sent. Hover over a particular day to view a tooltip that shows the detail for that day.

- User breakdown - This table presents a row for each team member with at least one message sent in the reporting period. See what’s working and how well its working using the following metrics: some text
- Messages sent
- Messages skipped
- Revenue generated
- Revenue per message
That’s a wrap
This article has shown the two distinct reports available - Overview and Team Engagement - users can access key metrics and detailed breakdowns to inform strategic decision-making. By leveraging these reports and adjusting filters as needed, users can optimize their Contact usage and drive meaningful results. Remember, for any assistance with access or configuration, our dedicated support team is just a message away! You can message Support using the chatbot in the bottom right of the page.
