
Serve reports
Serve reports serve as a natural extension of Serve, providing valuable insights into in-store experiences. They enable the analysis of customer engagements, store details, timing, and associated purchases, empowering you to gauge the impact of your Sales Associates' efforts.
Serve reports are located in Measure > Activity > Serve.
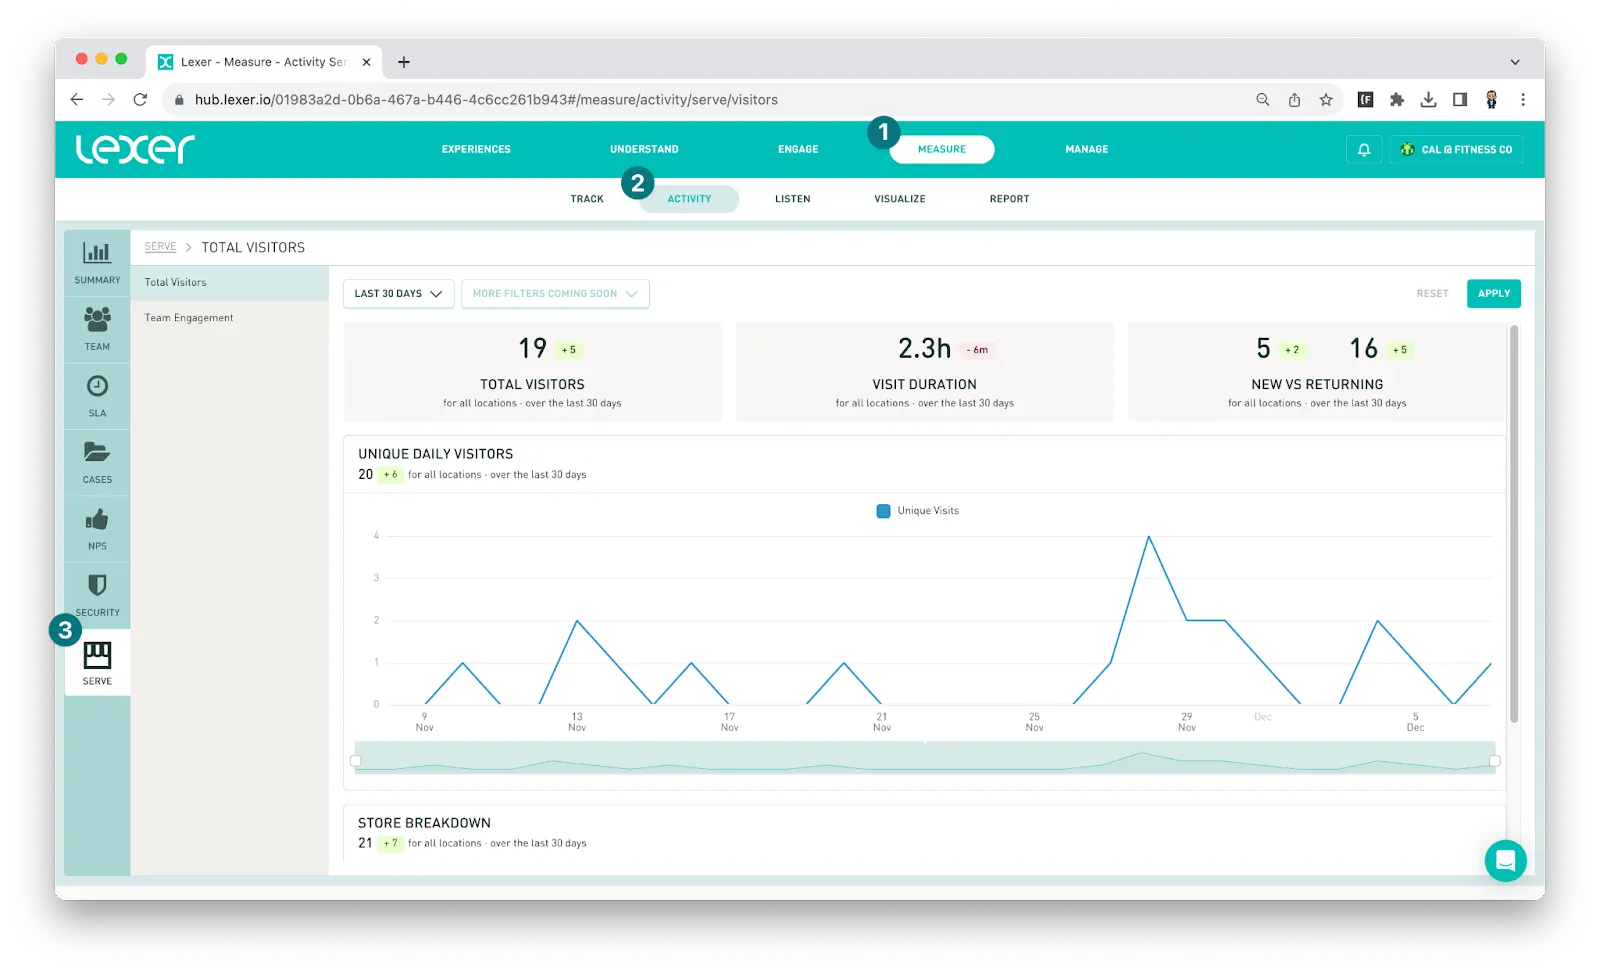
Visibility depends on group permissions in the Hub. Users need "Can manage Serve?" permissions (typically via the Serve: Manager group) to access Serve reports. For more information about permissions, you can check out our Group Permissions Learn article.
There are three reports available for Serve:
- Total visitors - Gain insights into your store customers.
- Team engagement - Analyze how your team is using Serve in each store.
- Sales Conversions - Track the influence on in-store and post-visit conversion.
Total visitors
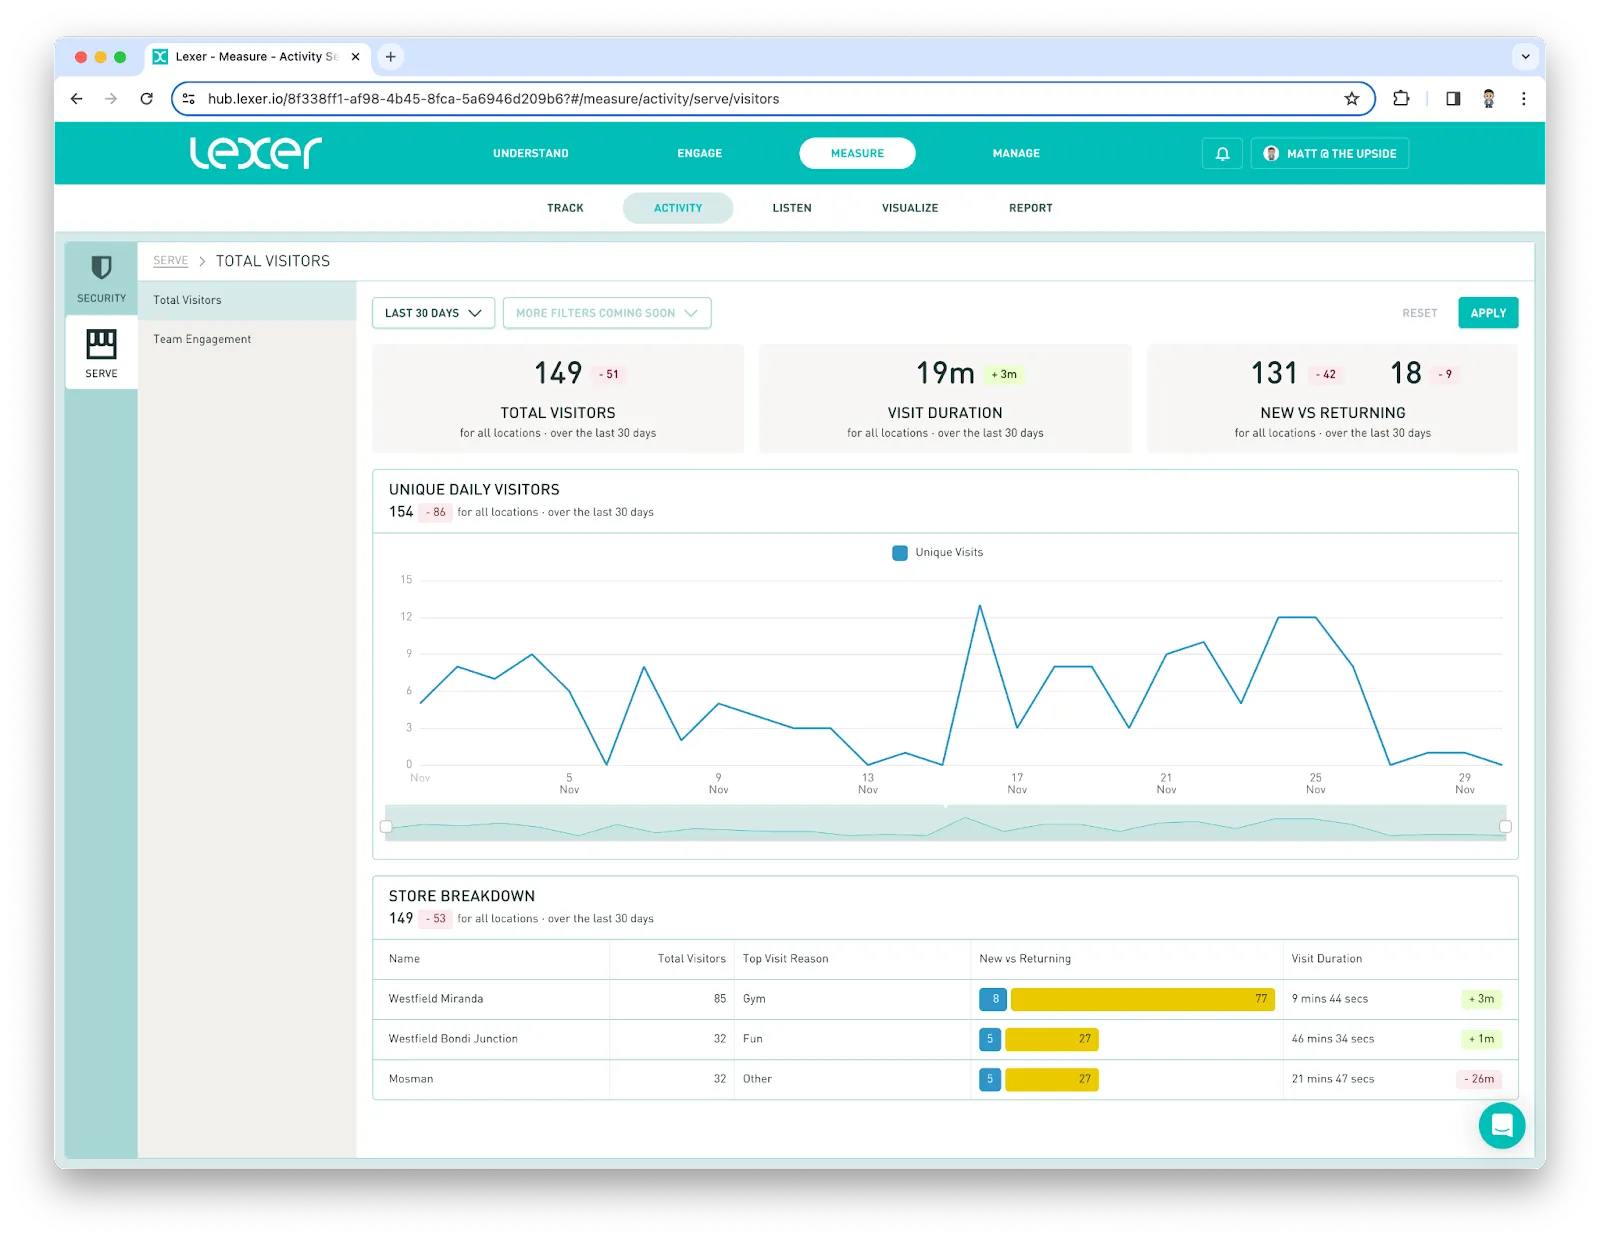
Measure and understand the customers visiting each of your stores using Serve. Understanding the metrics presented is really important to ensure you can create appropriate actions based on the insights they provide.
Each of the components on this report has been defined below so you have a clear idea what the values represent.
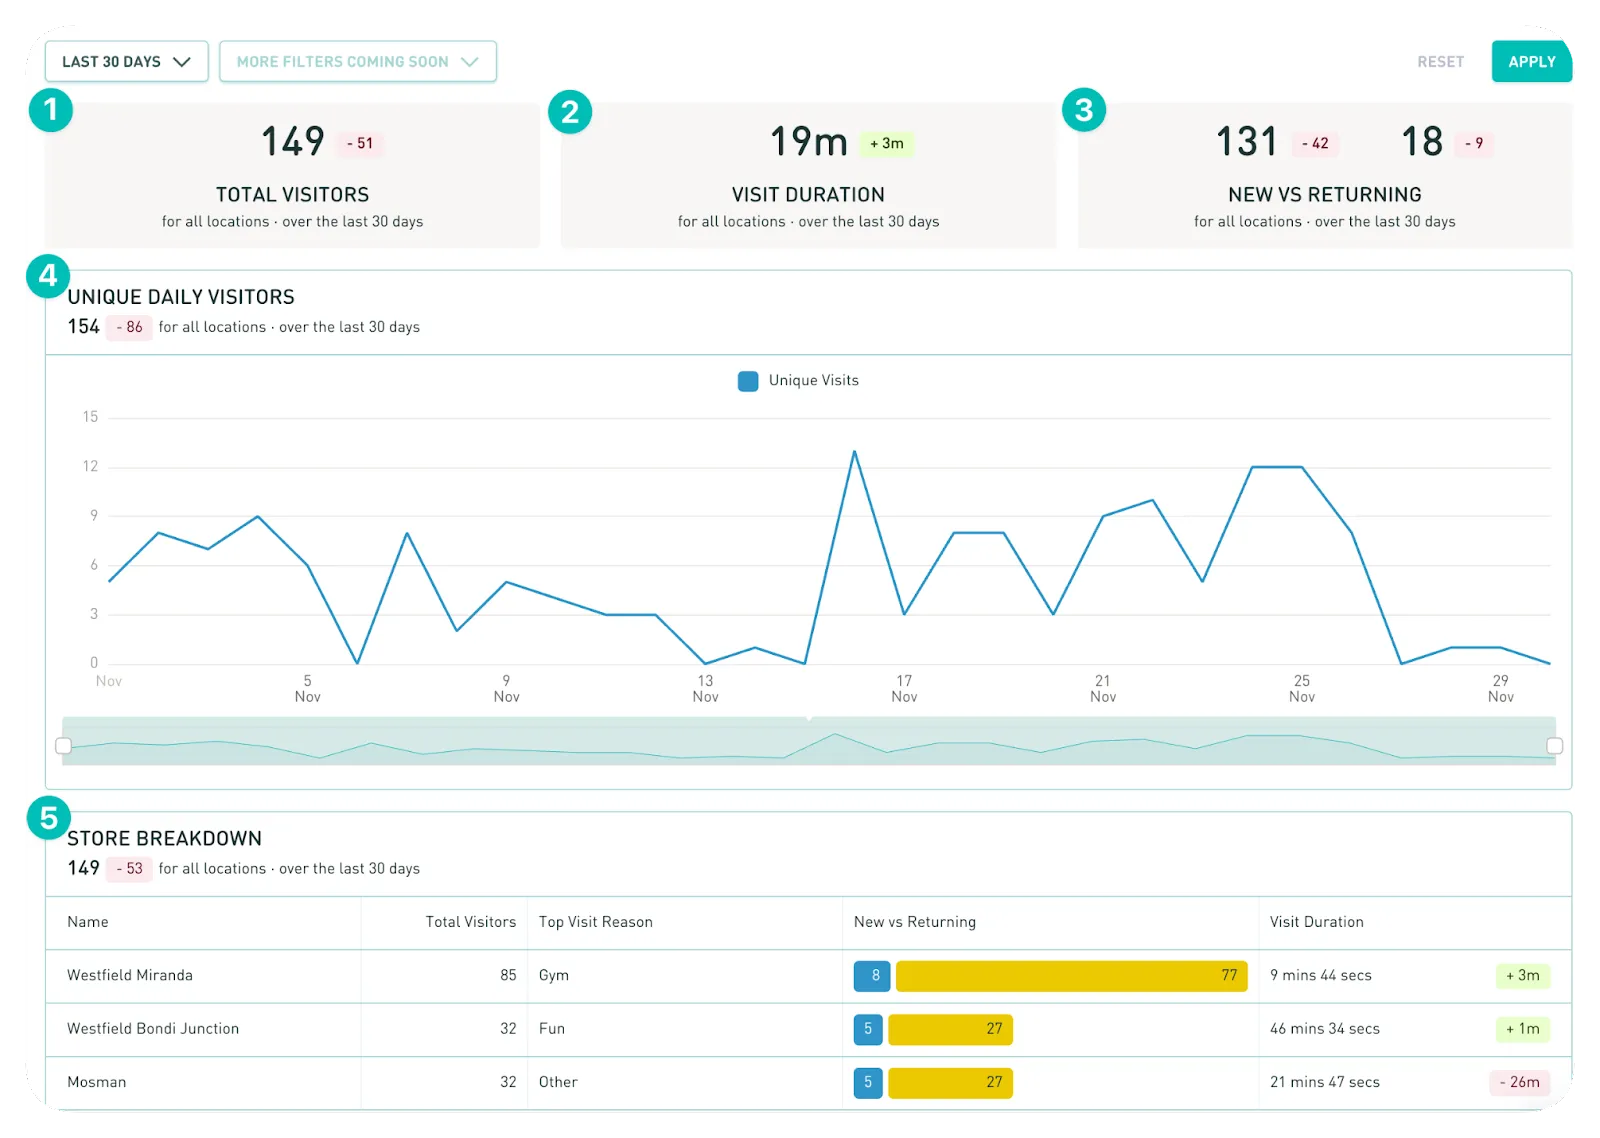
1. Total Visitors
The total number of unique visitors greeted across each store during this period. A greeting may result in a customer check in, signing up a new customer, or a greeted customer who declines to be checked in.
2. Visit Duration
The average visit duration for all checked in customers during the specified timeframe. Visit duration is measured from the time a customer is checked in to when they are checked out. A customer may be checked out manually (by clicking Check out) or automatically after 3 hours.
3. New vs Returning
You can analyze the split between new and returning customers greeted in store. New customers are those who indicate they have not shopped with the brand before, and returning customers are those who indicate they have shopped with the brand before. These values are set regardless of whether we retrieve and check in a profile in the CDP, so even those customers that say they have shopped but don’t want to checkin are counted as returning customers.
4. Unique Daily Visitors
Analyze the unique number of daily visitors across all of your stores. The total value for this chart will often exceed the Total Visitors metric as customers may return to your stores across multiple days in the reporting period.
5. Store Breakdown
You can view a breakdown for each of the key metrics by store location. This includes total visitor count, the top visit reason, new vs returning split, and the average visit duration.
Team Engagement
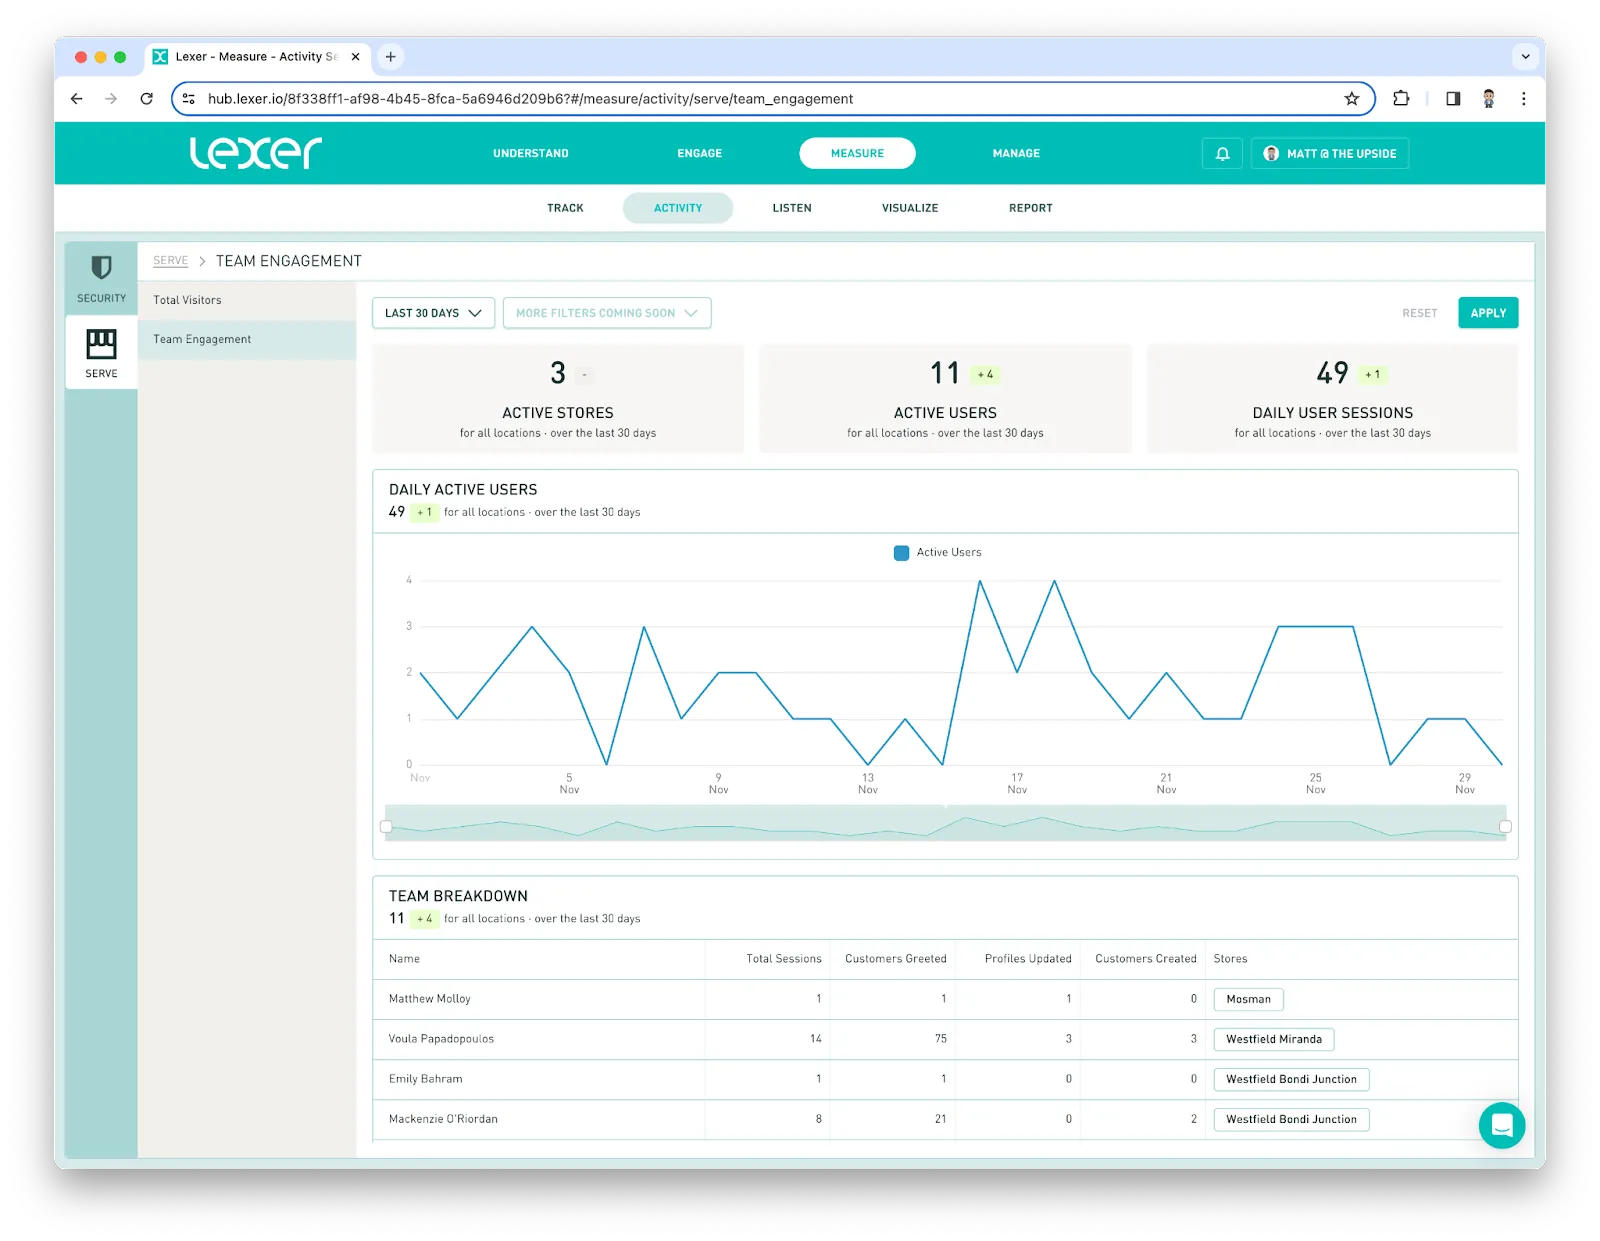
Measure and understand how your team is utilizing Serve in store. Understanding the metrics presented is really important to ensure you can create appropriate actions based on the insights they provide.
Each of the components on this report has been defined below so you have a clear idea what the values represent.
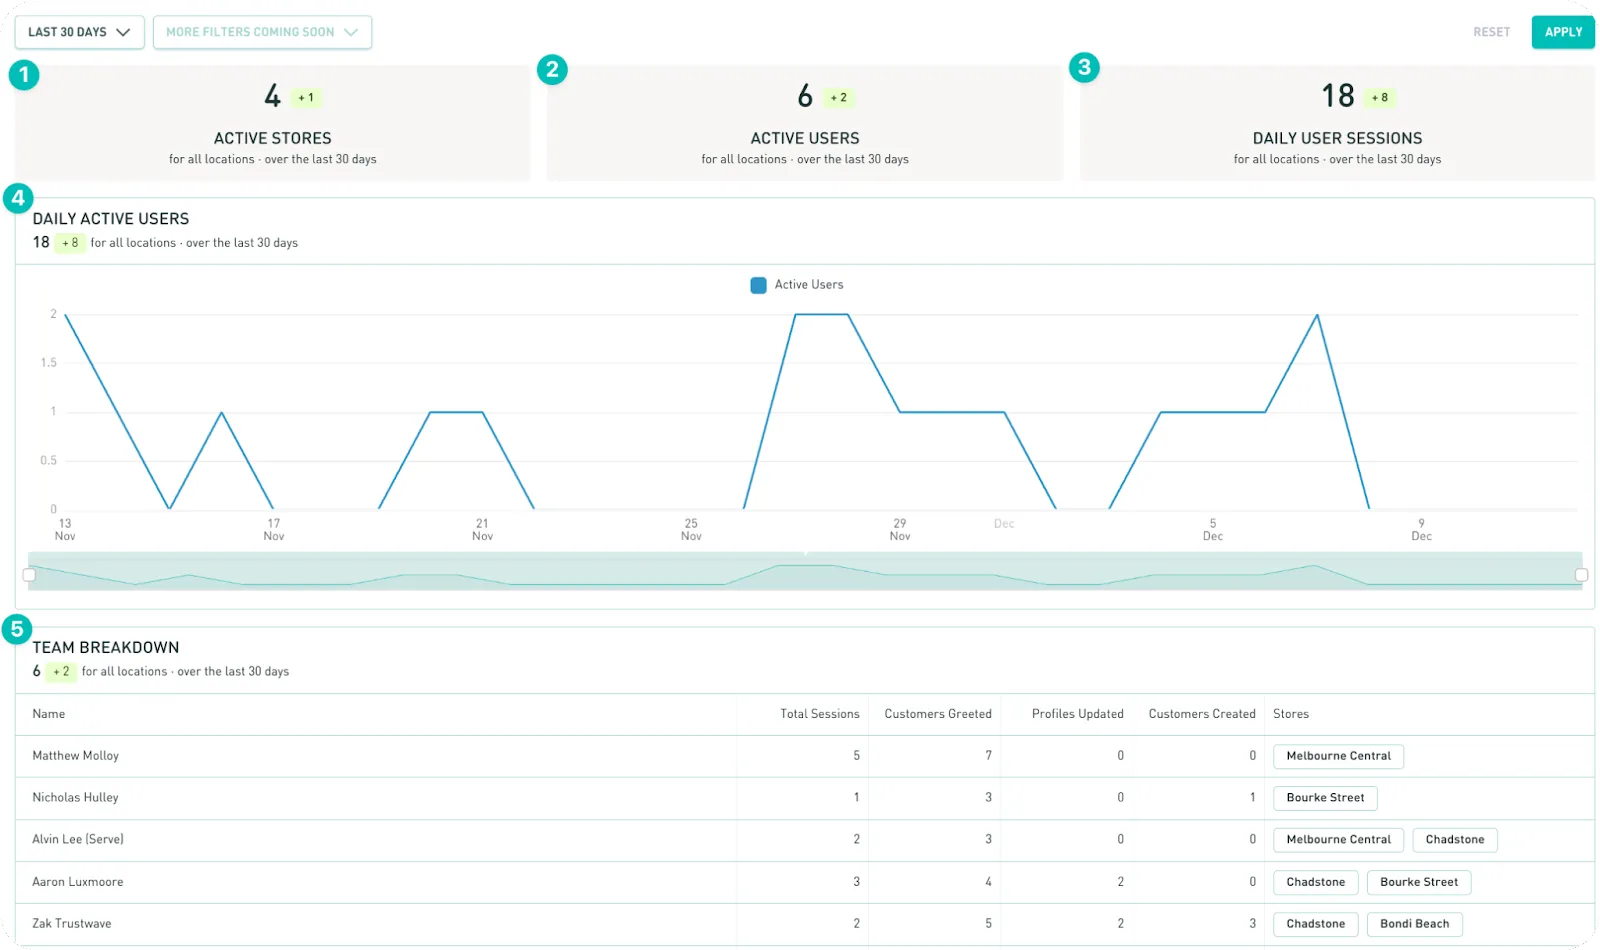
1. Active Stores
The number of store locations with activity in this period. A store will measure activity if any of your team members greet or check in at least one customer from a store. Use this to broadly gauge how Serve is being adopted across your business.
2. Active Users
The number of team members with activity in this period. A team member will measure activity if they greet or check in at least one customer. Use this to understand how many staff are adopting Serve in your business.
3. Daily User Sessions
It measures a daily session, for each team member, who greets or checks in a customer. We added this metric to help understand adoption in more detail. It’s a way for us to understand if Serve is being used more or less than the previous period.
Let’s take a look at an example. We have Mary, David, and Ben. Mary works on Monday, Tuesday, and Friday. David on Saturday. Ben on Saturday and Sunday. If each of the team members greet at least one customer during the week, we would measure 6 daily user sessions (3 for Mary, 1 for David, 2 for Ben).
4. Daily Active Users
Analyze the daily number of active users across your stores over time. Use this chart to measure if more or less team members are utilizing Serve in your stores.
5. Team Breakdown
You can view a breakdown for each active team member in this reporting period. This includes total sessions, customers greeted, profiles updated (using forms), and customers created (using the create profile form). For example: Mary (3 sessions), David (1 session), Ben (2 sessions) - total 6 daily user sessions.
Sales conversion
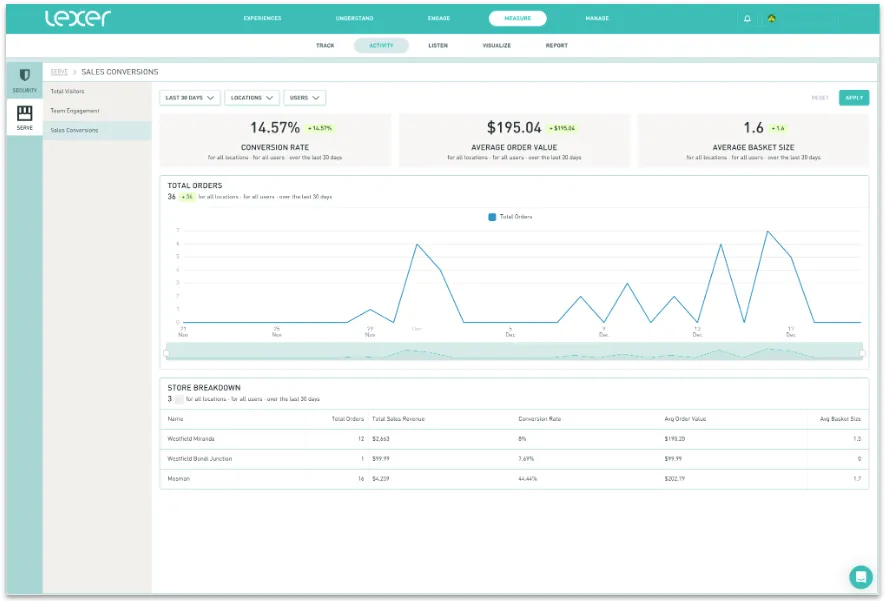
1. Conversion rate
Of the identified store visitors checked-in and assisted with Serve, how many then went on to make a purchase, in-store or online, within the selected attribution window.
2. Average order value
The average value of orders made during that time.
3. Average basket size
The average number of items purchased in each order.
4. Total orders over time
The number of orders charted over time.
5. Store breakdown
Key metrics for each store you have Serve deployed.
That’s a wrap!
This article highlights the Serve reporting how to interpret these reports. If you have any questions, please reach out to Support using the chat in the bottom right hand corner of the page.
