Where do your best customers live? Use geographic insights to maximize media spend and conversion
By analyzing your customers location data and combining that with their purchase behavior, marketers can gain valuable insights into their target audience's product preferences, habits, and needs. These insights can be used to develop targeted marketing campaigns that will maximize media budgets and improve campaign performance.
Understanding where your best customers live can be an important factor in deciding things like:
- Where to focus your resources to provide the most revenue impact.
- Where to add new (or close existing) stores.
- What geographies will give you the best bang for buck in paid channels.
In Lexer you can easily identify the location of your customers by city, state, country or zip code / postcode. In this article, we'll explore the benefits of using these attributes to get the most out of your budget and how you can do this in the Hub.
How can I identify where my most valuable customers live?
The first step to using geographical insights to optimize your media spend is to determine where your best customers live. To show you how to do this, let’s use our demo Hub FitnessCo as an example using the top 20% of your customers based upon their spend:
Let’s jump into the Hub.
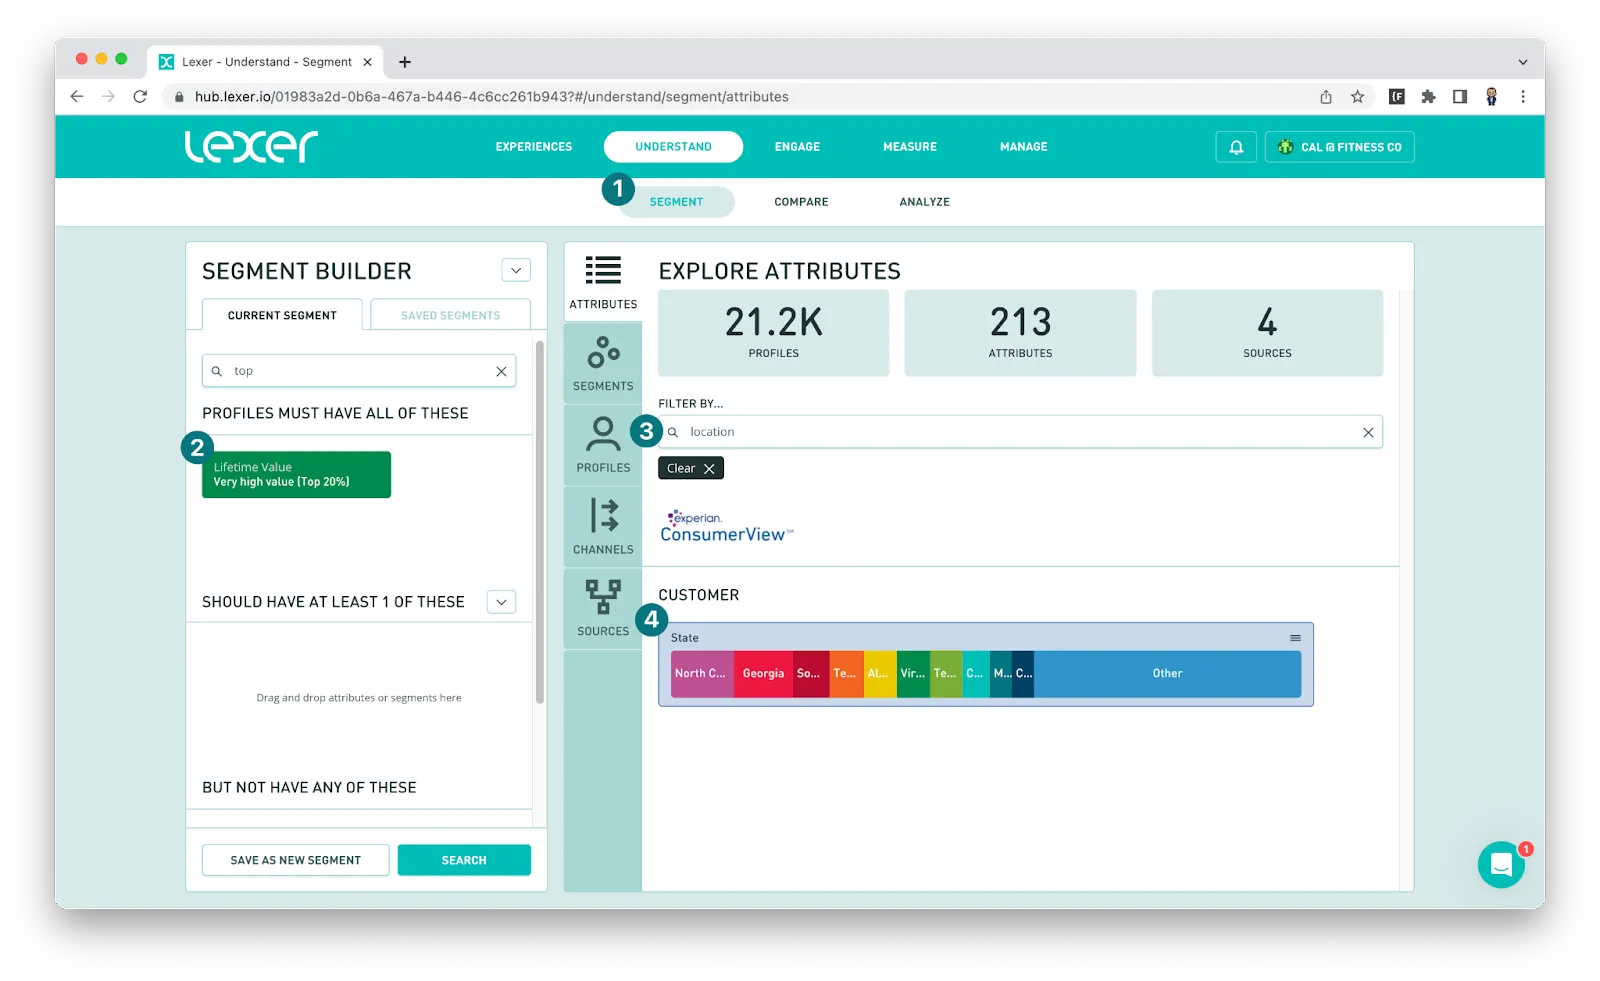
- Navigate to Understand > Segment.
- Search for the Lifetime Value: Very high value (Top 20%) attribute and add this to the PROFILES MUST HAVE ALL OF THESE filter in the Segment Builder.
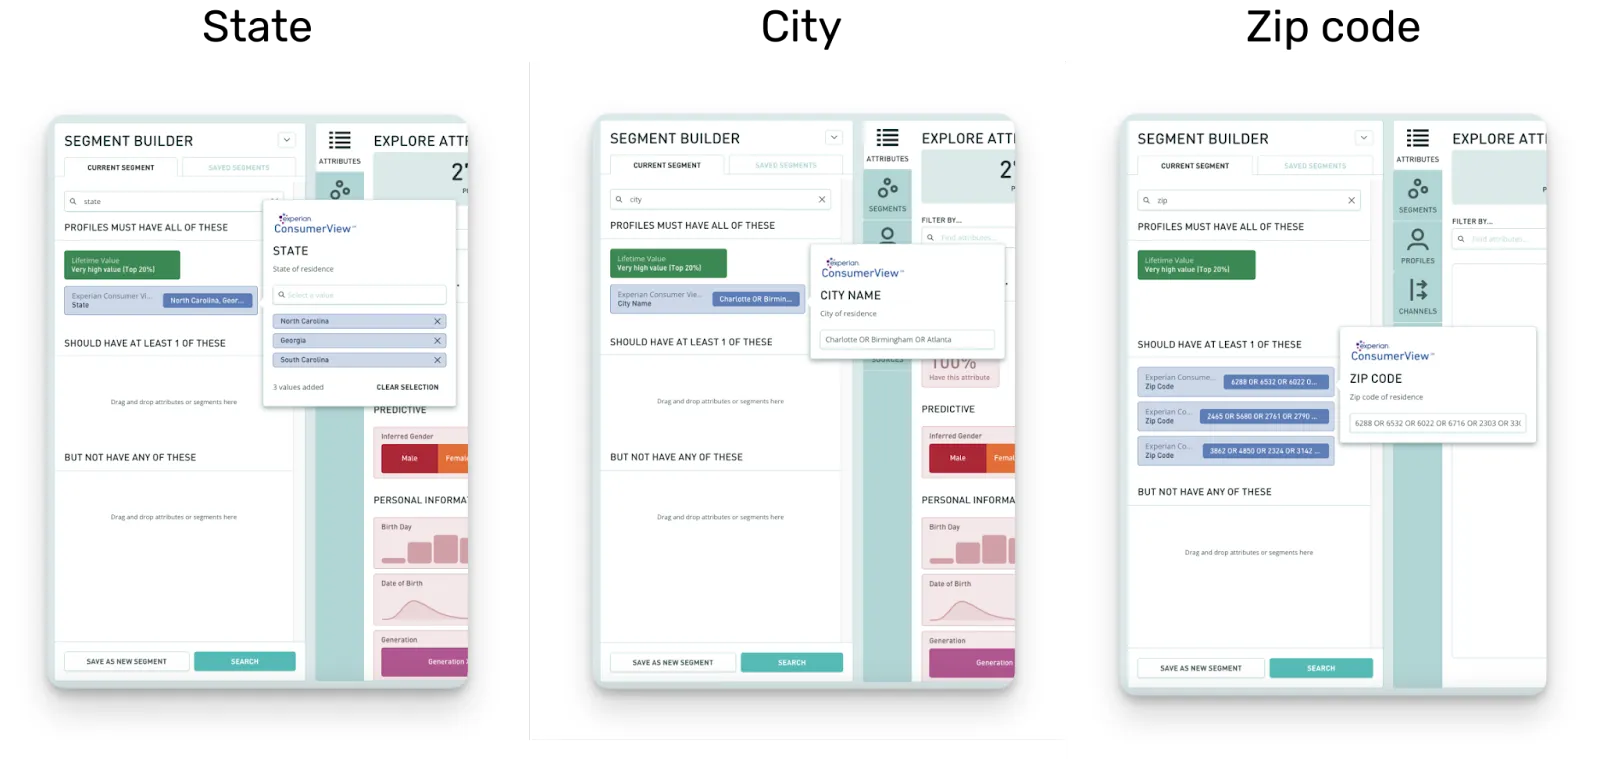
- In EXPLORE ATTRIBUTES, search for “location”. You may have a few options available. Choose the State attribute.
*note here you could choose City or Zip code, we’ll come back to this later in this article. - Click on the State attribute.
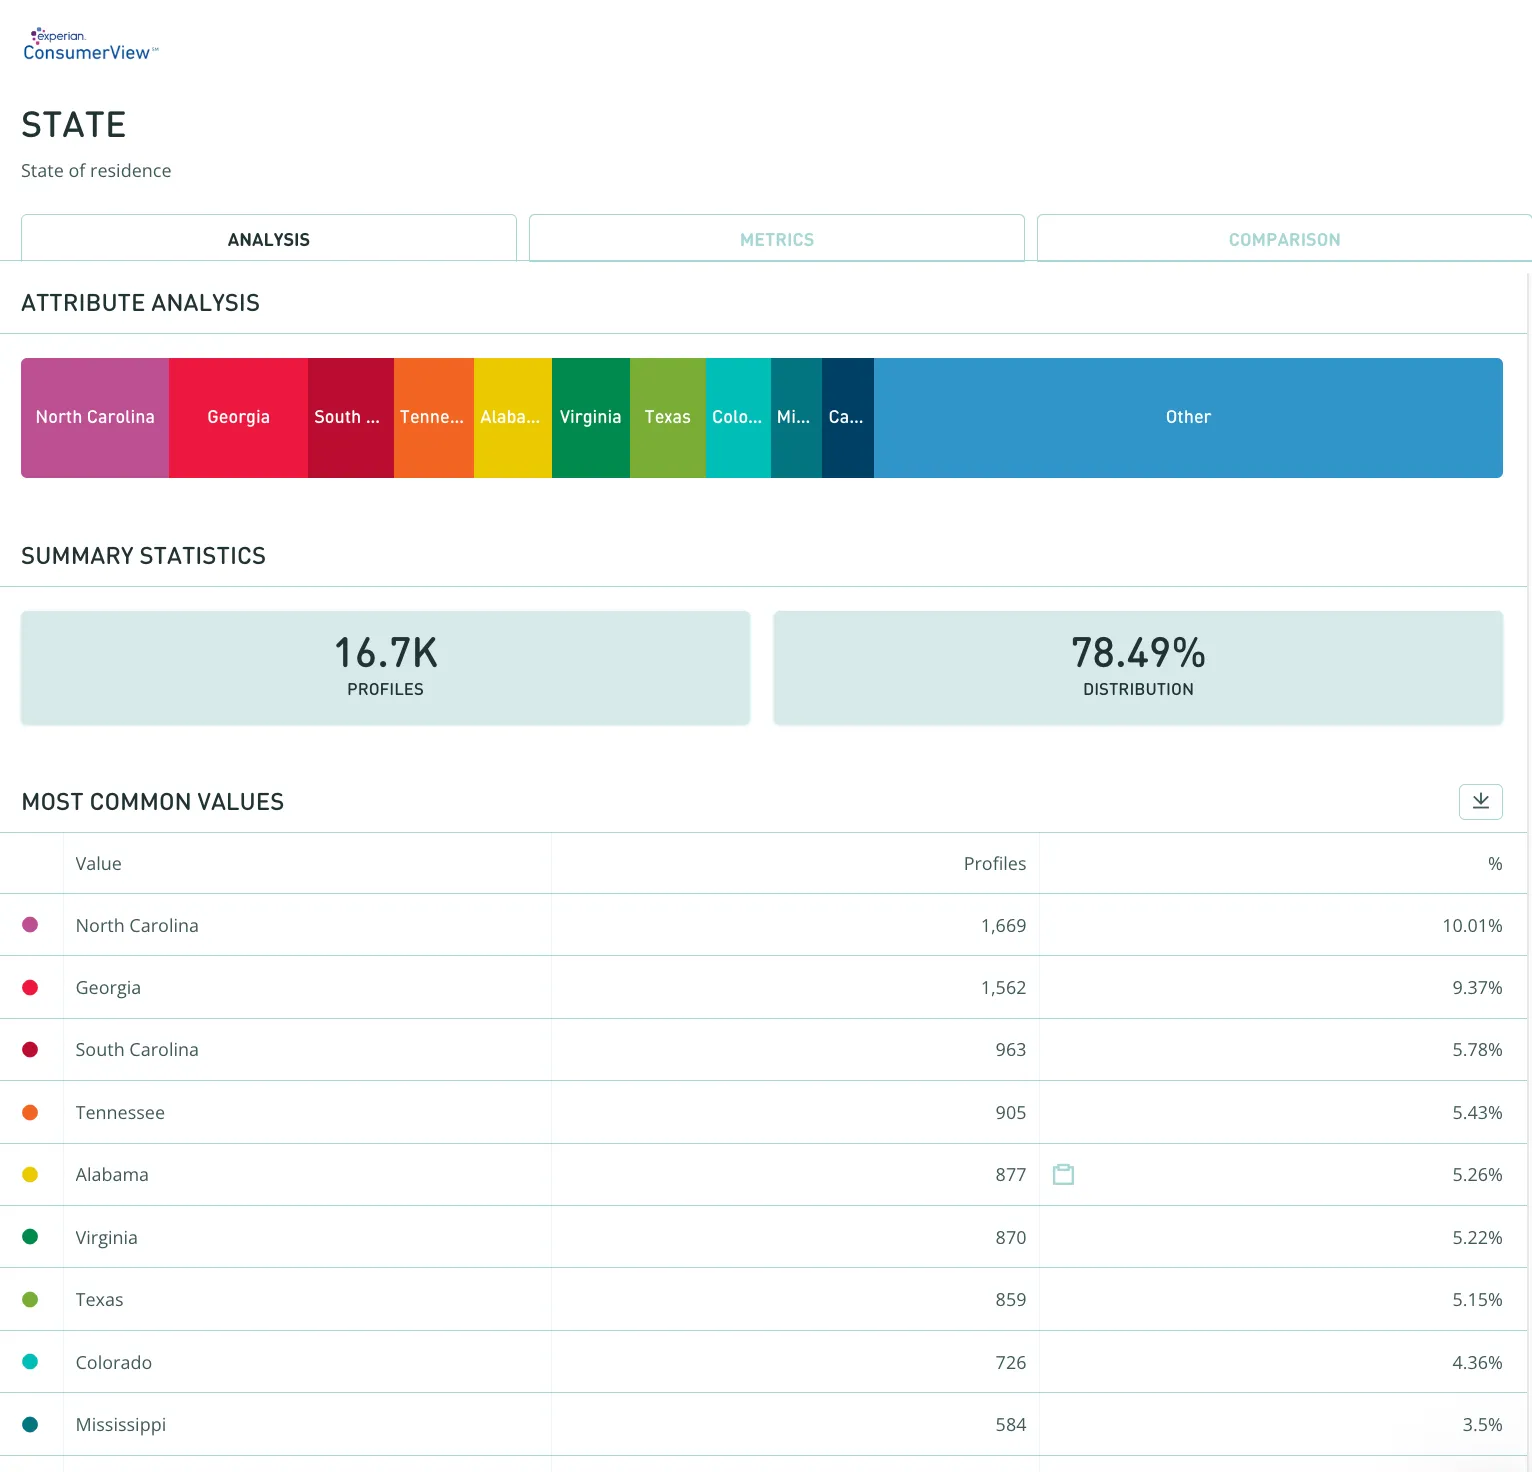
This data tells us the volume of the customers with the Lifetime Value: Very high value (Top 20%) segment in each state. We can see 10% of this group of customers is from North Carolina. Now, let’s figure out what we can do with this information.
Note, the definition of a high value customer for your business may be different (e.g. 80% of L12M revenue might come from the top 40% of your customer base), so adjust the definition of the segment as needed.
We know where our valuable customers live, what’s next?
Now that we have an idea of which State our most valuable customers live, we can start to get even more granular with this information. We can drill down to which cities, and even post/zip codes your best customers live. Targeting these cities and codes in your paid channels can improve both customer engagement and sales revenue.
Using the same process outlined above for state, simply search for ‘city’:
- Navigate to Understand > Segment.
- Search for the Lifetime Value: Very high value (Top 20%) attribute and add this to the PROFILES MUST HAVE ALL OF THESE filter in the Segment Builder.
- In EXPLORE ATTRIBUTES search for “location”. You may have a few options available, we could choose the City attribute.
- Click on the City attribute.
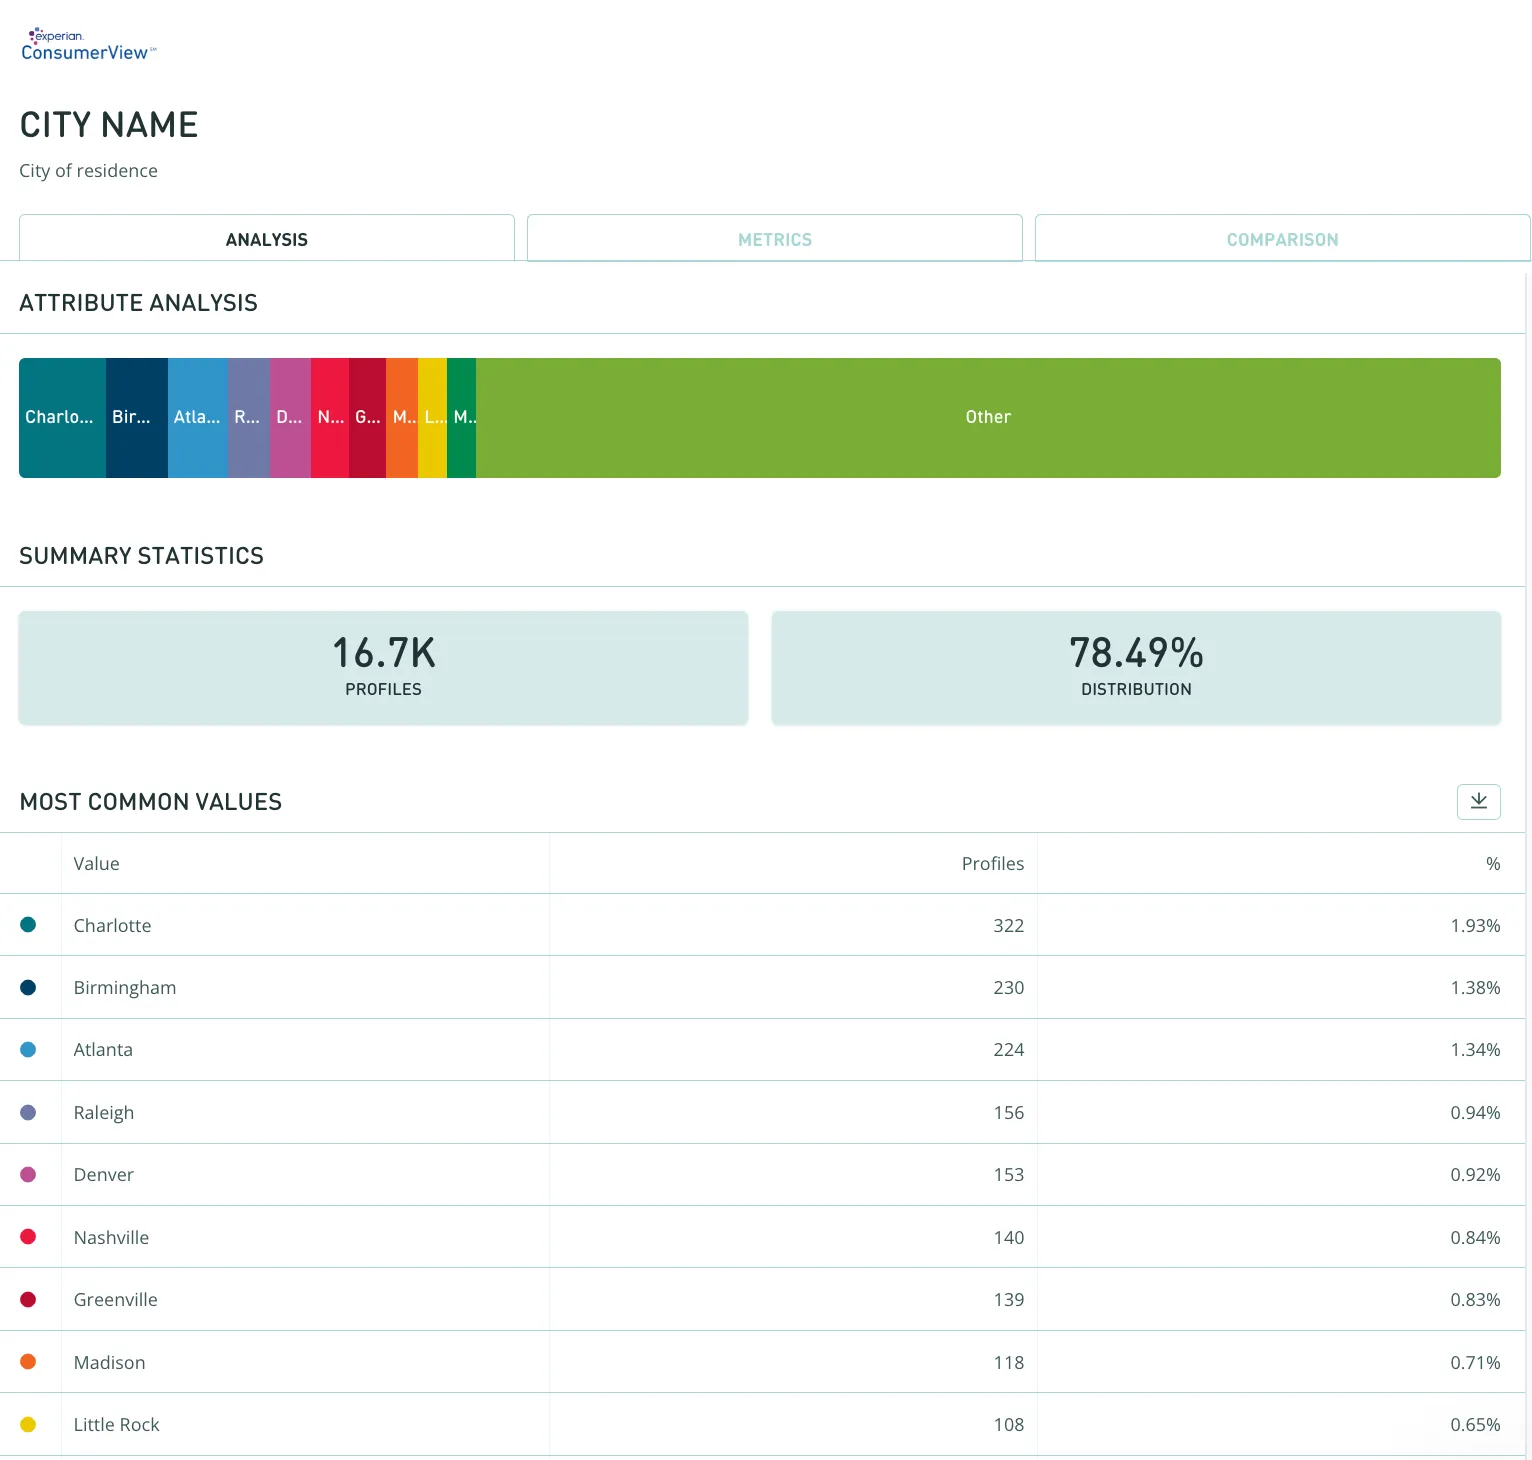
We can see that searching on City produces a much larger volume of “Other”. This is because there are so many more cities in the data table compared to states. The top 10 items will be shown in this graph, anything else will be accumulated into the “Other” category.
We can do this with the Zip Code attribute too.
Next step, Set up some location based segments for comparison & insight
Now that we know how to query the geographic data, let's create some segments and compare them for insight.
In our example we are going to use cities where the largest volume of our very high value customers live, and compare these with another group of cities that we consider our flagship locations. The aim is to determine which of these segments provide the best opportunities to engage and convert customers.
Navigate to Understand > Respond.
- Search for the Lifetime Value: Very high value (Top 20%) attribute and add this to the PROFILES MUST HAVE ALL OF THESE filter in the Segment Builder.
- Search for the City Name attribute. Add the list of cities using boolean search functions to separate the different cities. In our example we’ll just use the “OR” function. In this example we’ve used the top 3 cities we discovered in our initial analysis above; Charlotte, Birmingham and Atlanta.
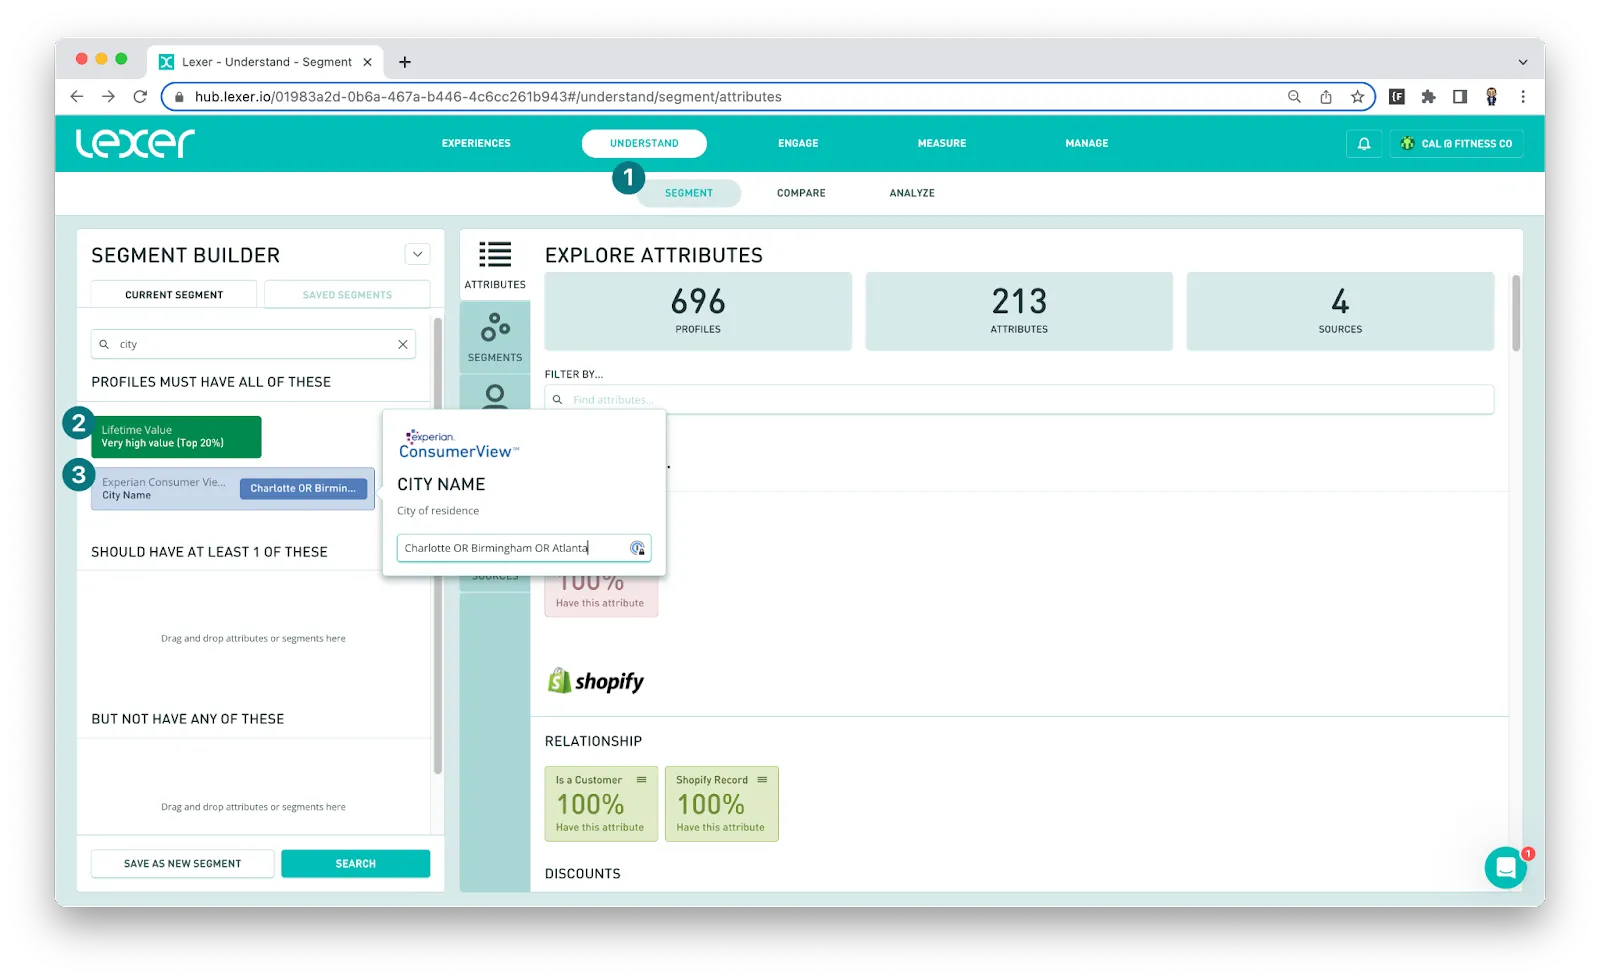
- Click SAVE AS NEW SEGMENT and fill in the details to make sure this segment is clear to your team eg. Top 20% - North Carolina, Georgia, South Carolina.

- Create another Segment containing the audience for comparison using the same method outlined above. The example we will use includes 4 cities where our flagship stores are located (fictional); Columbus, Charleston, Lexington and Athens.
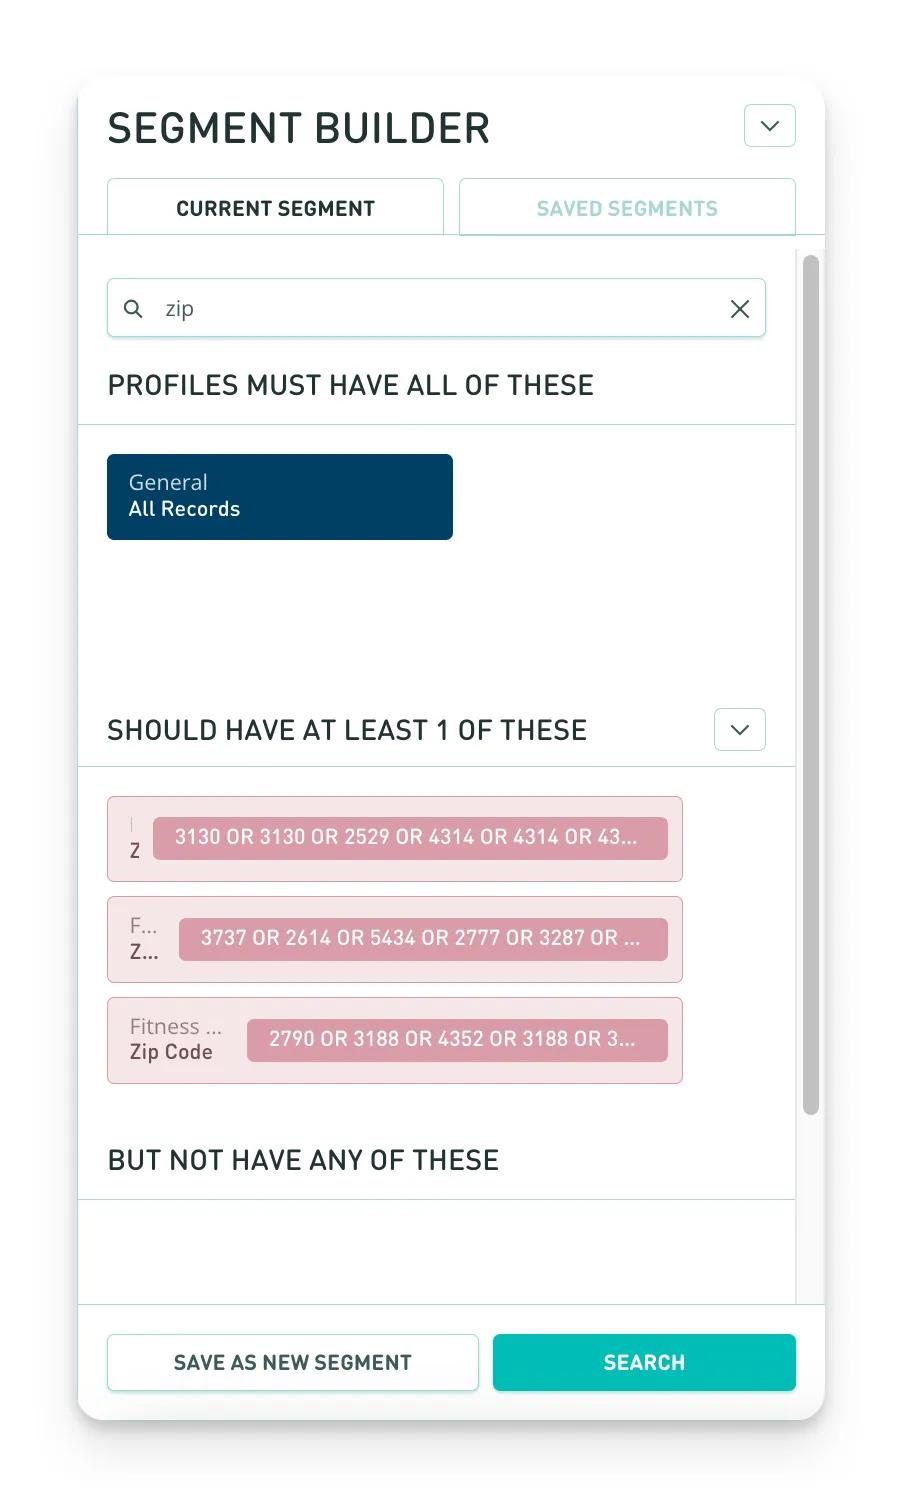
Here are 3 examples of segments that we have set up to target specific locations after some analysis. It’s entirely up to you how specific you would like these queries to be. Revisit these on a regular basis and make adjustments as you notice the location of your best customers change.
Using a significant number of zip codes or cities?
Compare your segments
Once these segments are saved head to Compare for some further insights.
- Navigate to Understand > Compare.
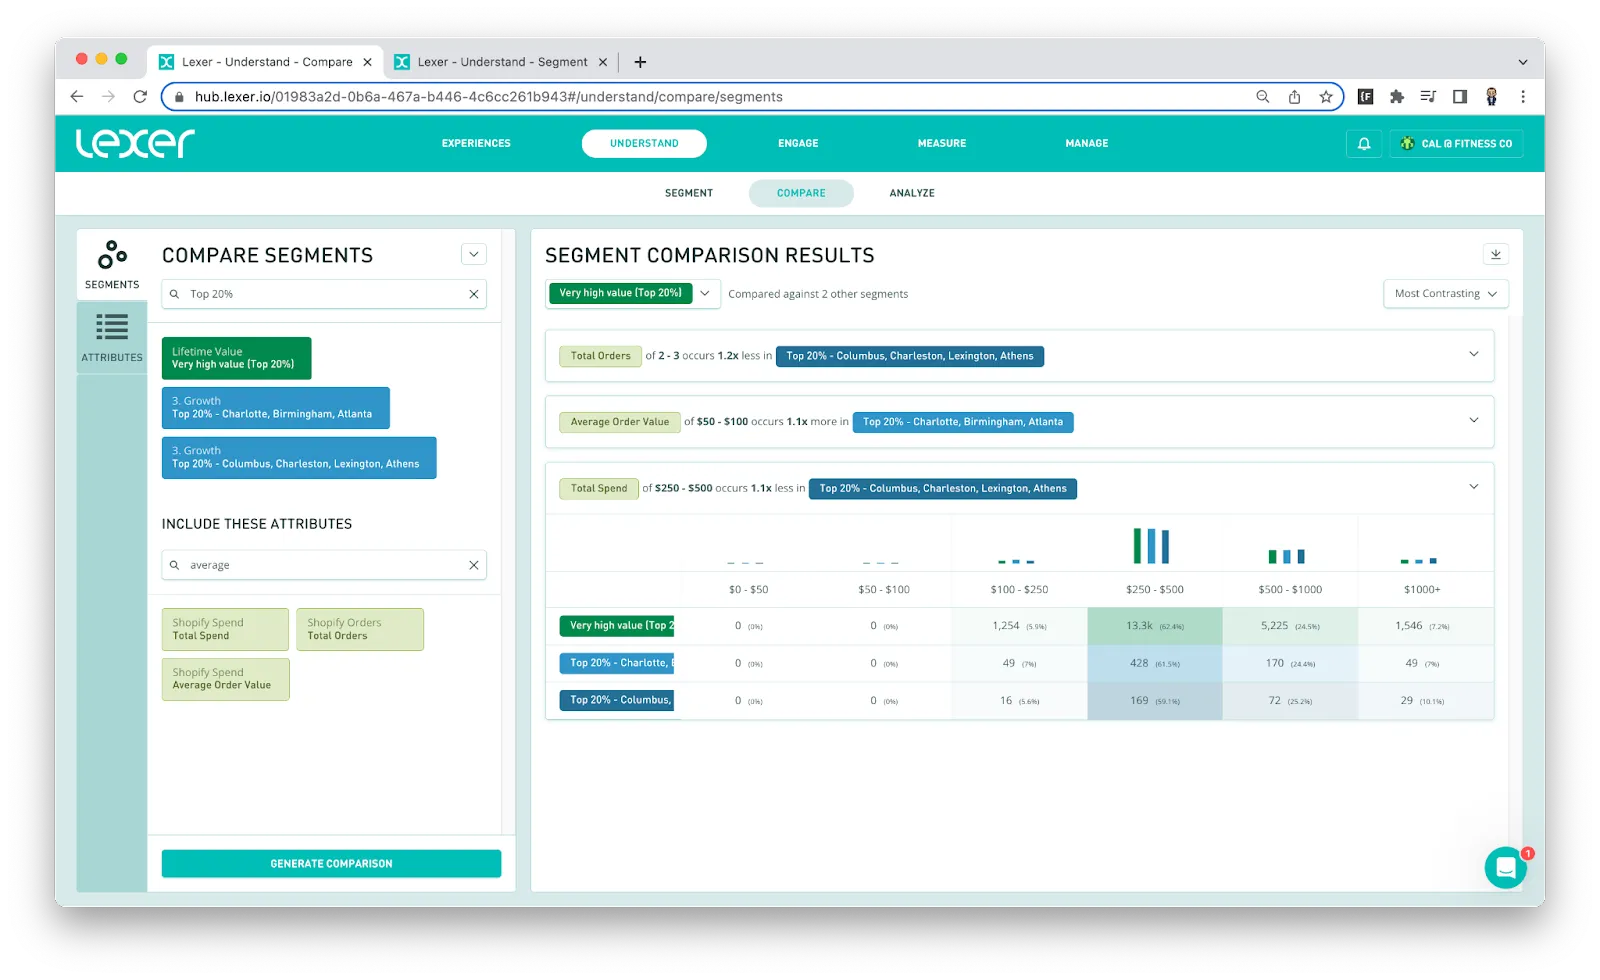
* If you need a compare refresher, we have a great article about comparing segments. - Add the segments you would like to compare using the search function. Our example is comparing three segments:
- Very high value (Top 20%) - All customers that fall into this category are in the highest spend percentile.
- Top 20% - Charlotte, Birmingham, Atlanta - The segment created earlier in this article. This segment contains 3 cities with the largest volume of very high value customers (in the top 20% of customer lifetime value).
- Top 20% - Columbus, Charleston, Lexington, Athens - This segment contains the locations of the flagship retail stores (for our fictional business).
3. Add the attributes you would like to compare to the INCLUDE THESE ATTRIBUTES filter. For example, we’ve included the Total Spend, Total Orders and Average Order Value attributes to provide insights into some key marketing metrics. This comparison could also be used to understand products purchased or their Experian Mosaic profiles.
Setting up campaigns based on specific locations
Once we’ve had a look into the top locations of our high value customers, we can begin to use this information to create targeted location-based campaigns. You can tailor your messaging based on the customer's state, city or zip code and most popular products. With the right approach, geographic targeting can be a powerful tool.
You may have products that are best targeted to a certain state, city or zip code. There are a number of factors that could make you consider targeting customers based on location.
A few common use cases:
- The weather in the location could dictate the apparel most likely purchased, so if it's usually pretty cold sell them a jacket.
- Customers living near the ski mountains might buy more often, but their average spend may be less than a customer living in an affluent area that only goes skiing twice a year, but wants to look the part.
- Local insights might indicate that customers prefer a certain payment type, or that click and collect is more important to them.
- If the customer lives near the water they are more likely to purchase clothes appropriate for swimming.
- If the customer lives in an area famous for a particular product, use it! Sell your “I ♥️Charleston! for those customers. Or advertise your fresh seafood to specific customers that live near your coastal restaurants that can make the most of the local produce.
Get creative and help your customers see the most effective marketing materials while saving your marketing budget, win-win!
That’s a wrap!
Understanding the location of your best customers can help you make more informed decisions about your geo-targeting in paid channels. Lexer makes it easy to identify the location of a specific segment by country, city, state, or postcode/zip code, and get the right marketing material to the right customers!

