Visualize overview

What’s a Visualize Screen?

Teams can spend hours on a Monday morning compiling a social media report from the previous week to be circulated to the business. Visualize replaces that process. With a fully customizable, live social report - you can keep track of what you need to, replicate your regular reporting, and have it display in real-time. What’s more, the link to your screen can be shared with anyone - inside or outside of the business.

So, you’re ready to build a report - which is assuming you’ve already compiled a search, and created a Saved Dive. If not, head over to Listen and do this now.

What do they look like?

Big Screen - large format display

3840

Visualize displays data in real-time with a live rolling feed. If your business wants to understand key metrics, such as volume; types of classifications; influential authors; and a variety of other options, then you can setup a Big Screen for display.

Standard Screen - for everyday reporting

3840

A dynamic reporting tool, displaying real-time changes, and replacing regular, static reporting methods.

What information goes on a Visualize Screen?

Each chart on your Report will display independently, using results from any Saved Dives you choose, meaning each one could show you something different. There are a number of different chart types to choose from - each displaying data from your chosen Saved Dives. Let’s go through them…

3840

1. Volume Charts

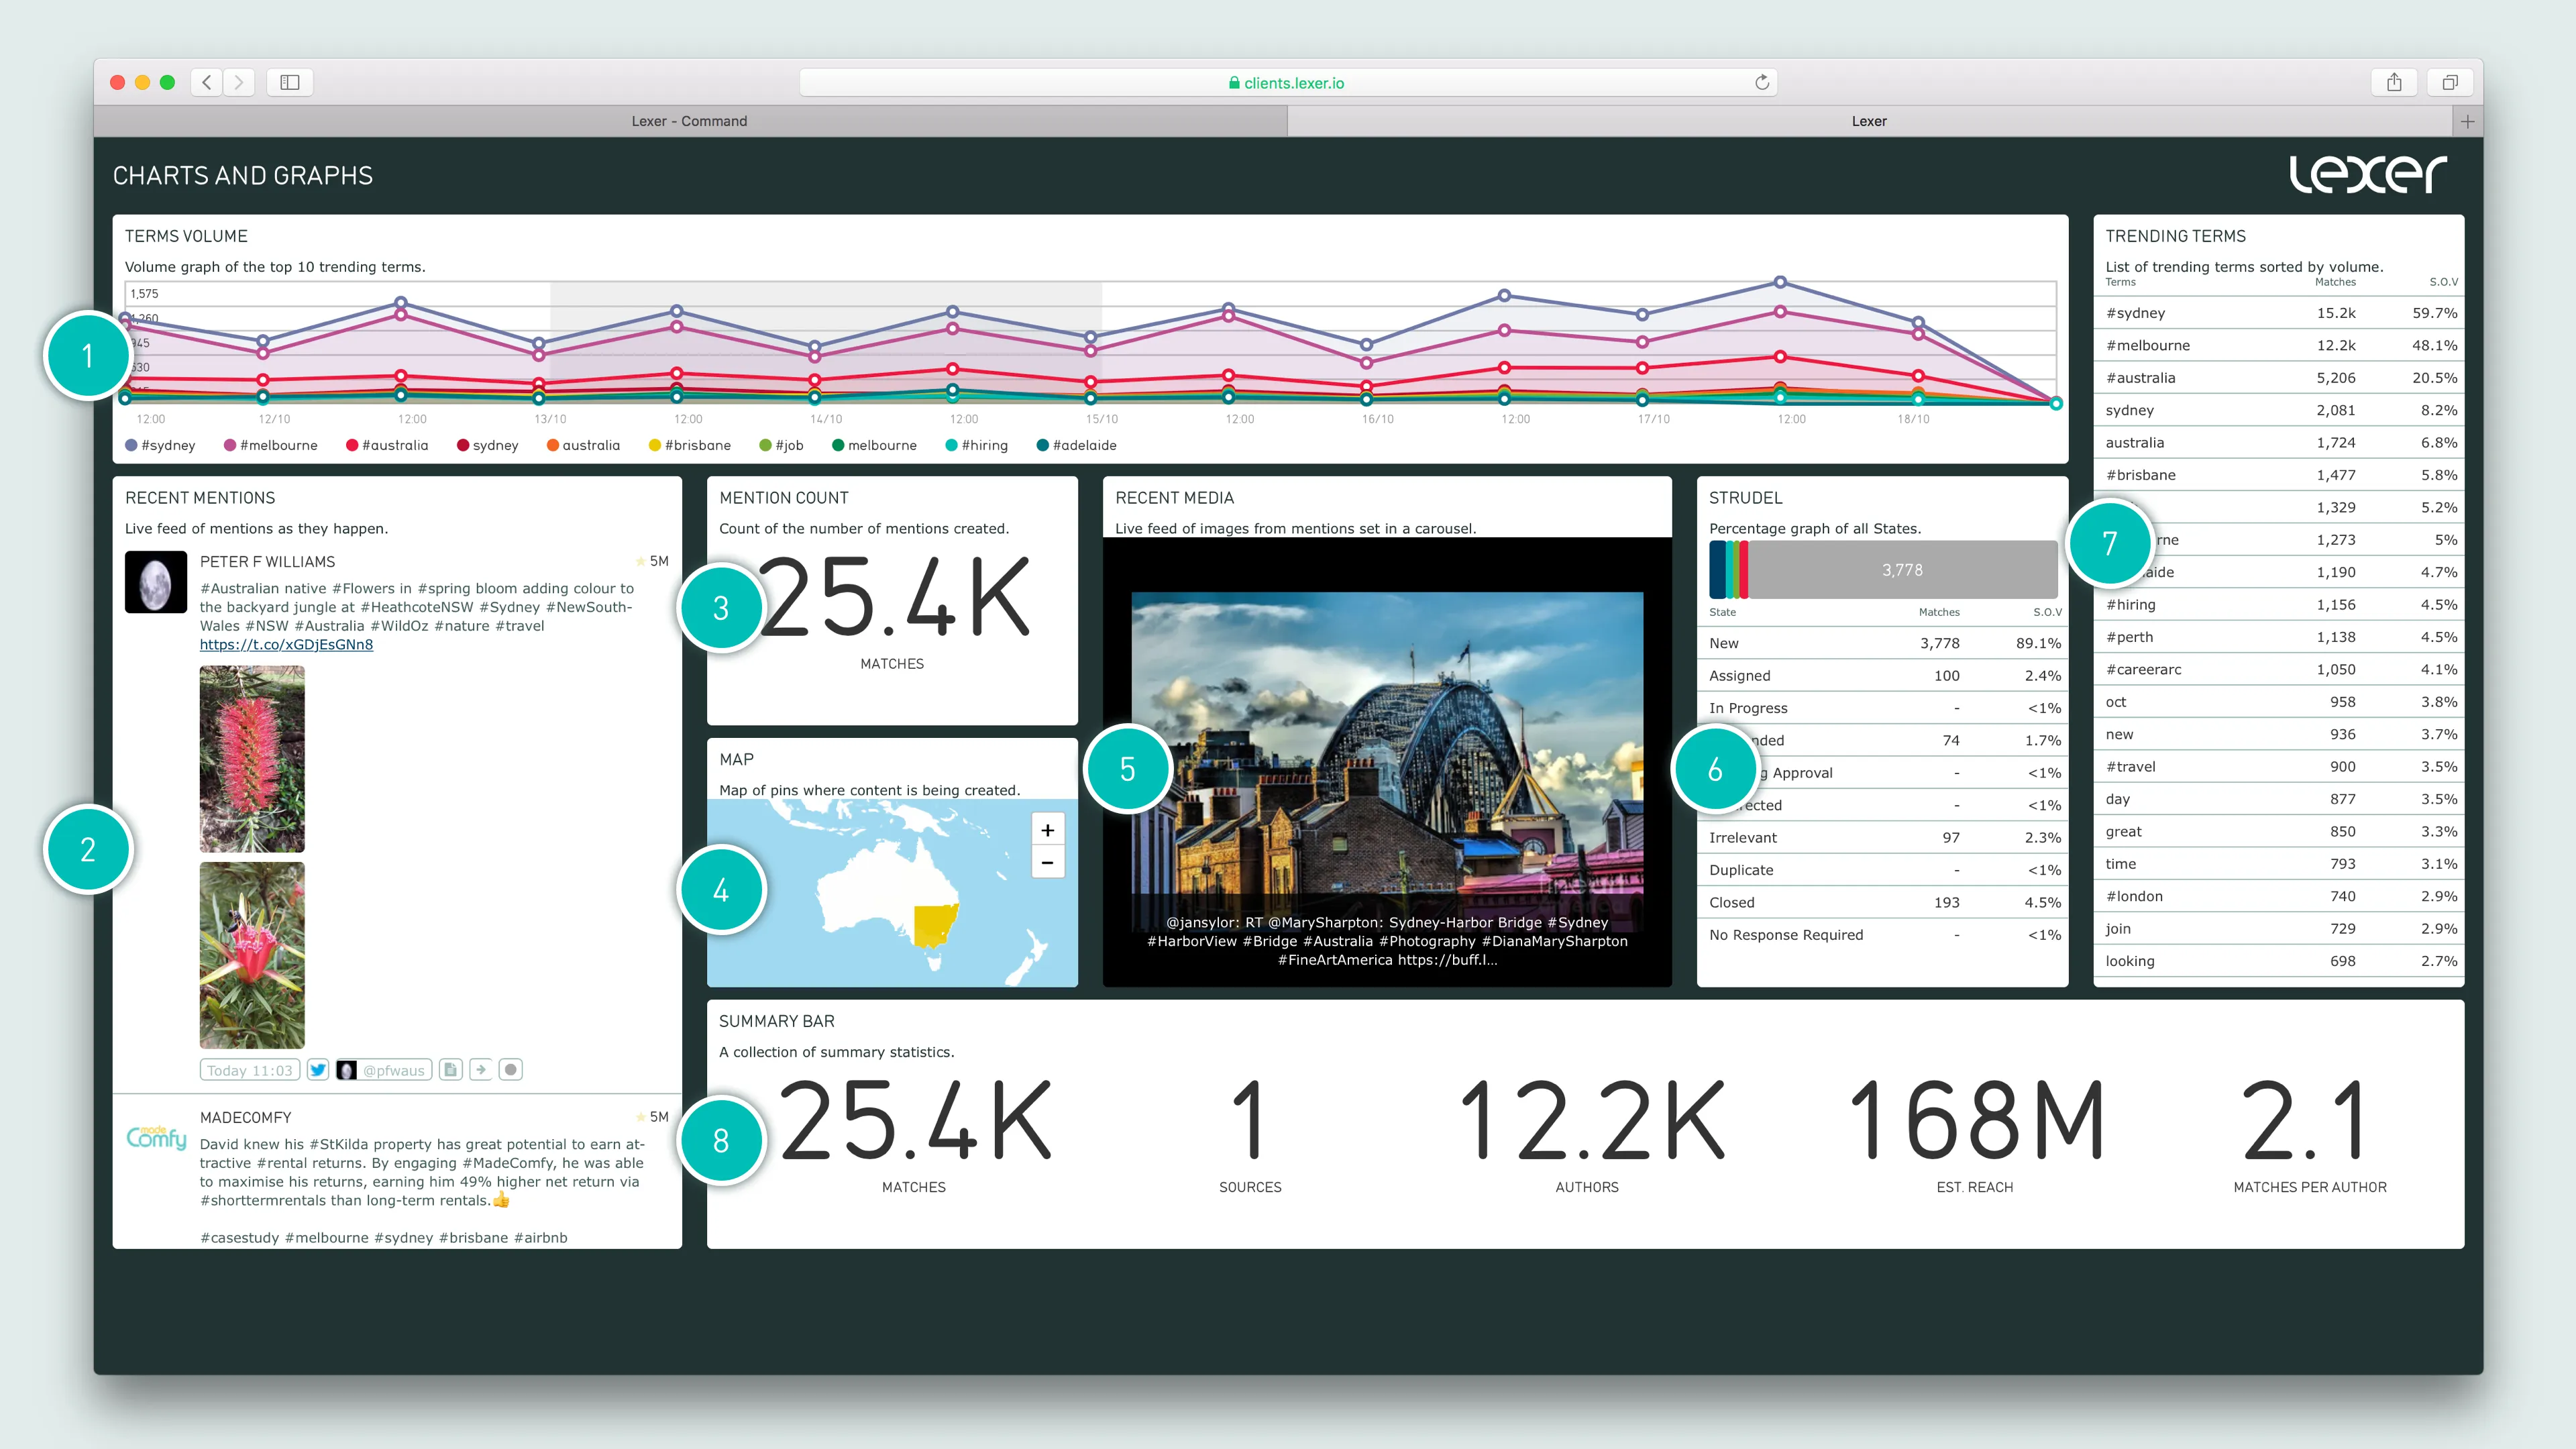
  • TERMS VOLUME - Volume graph of the top 10 trending terms.
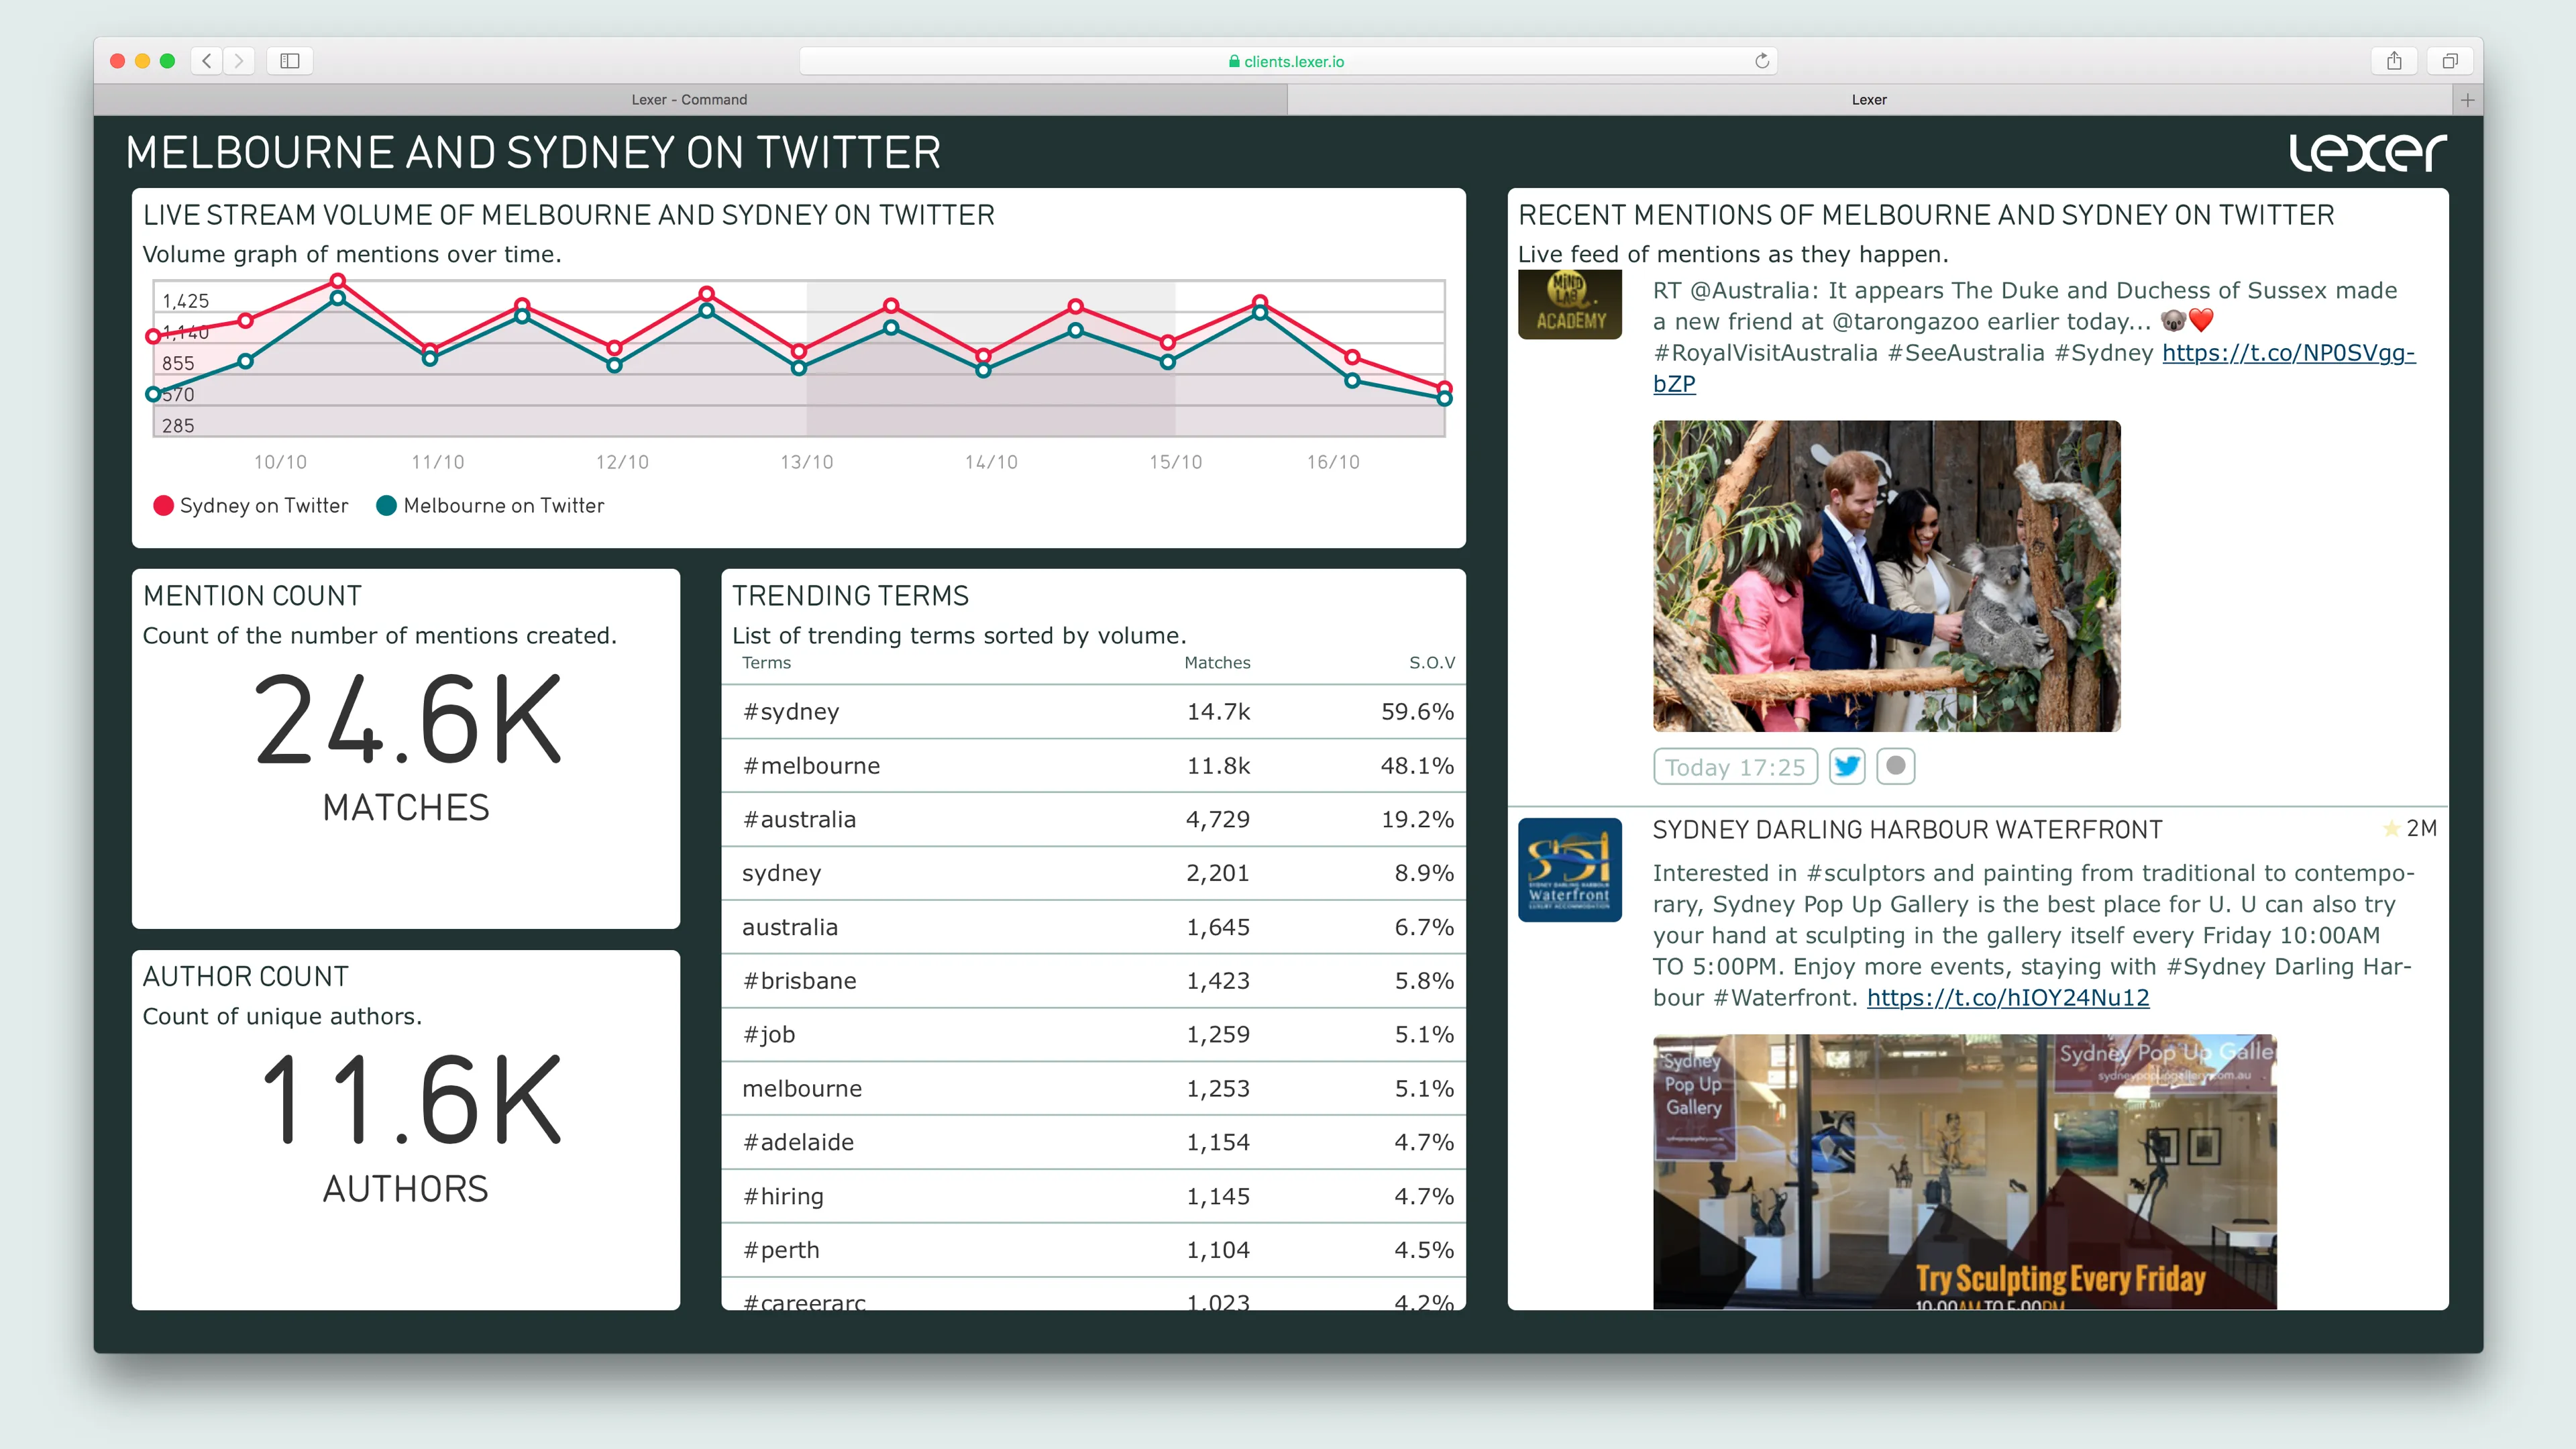
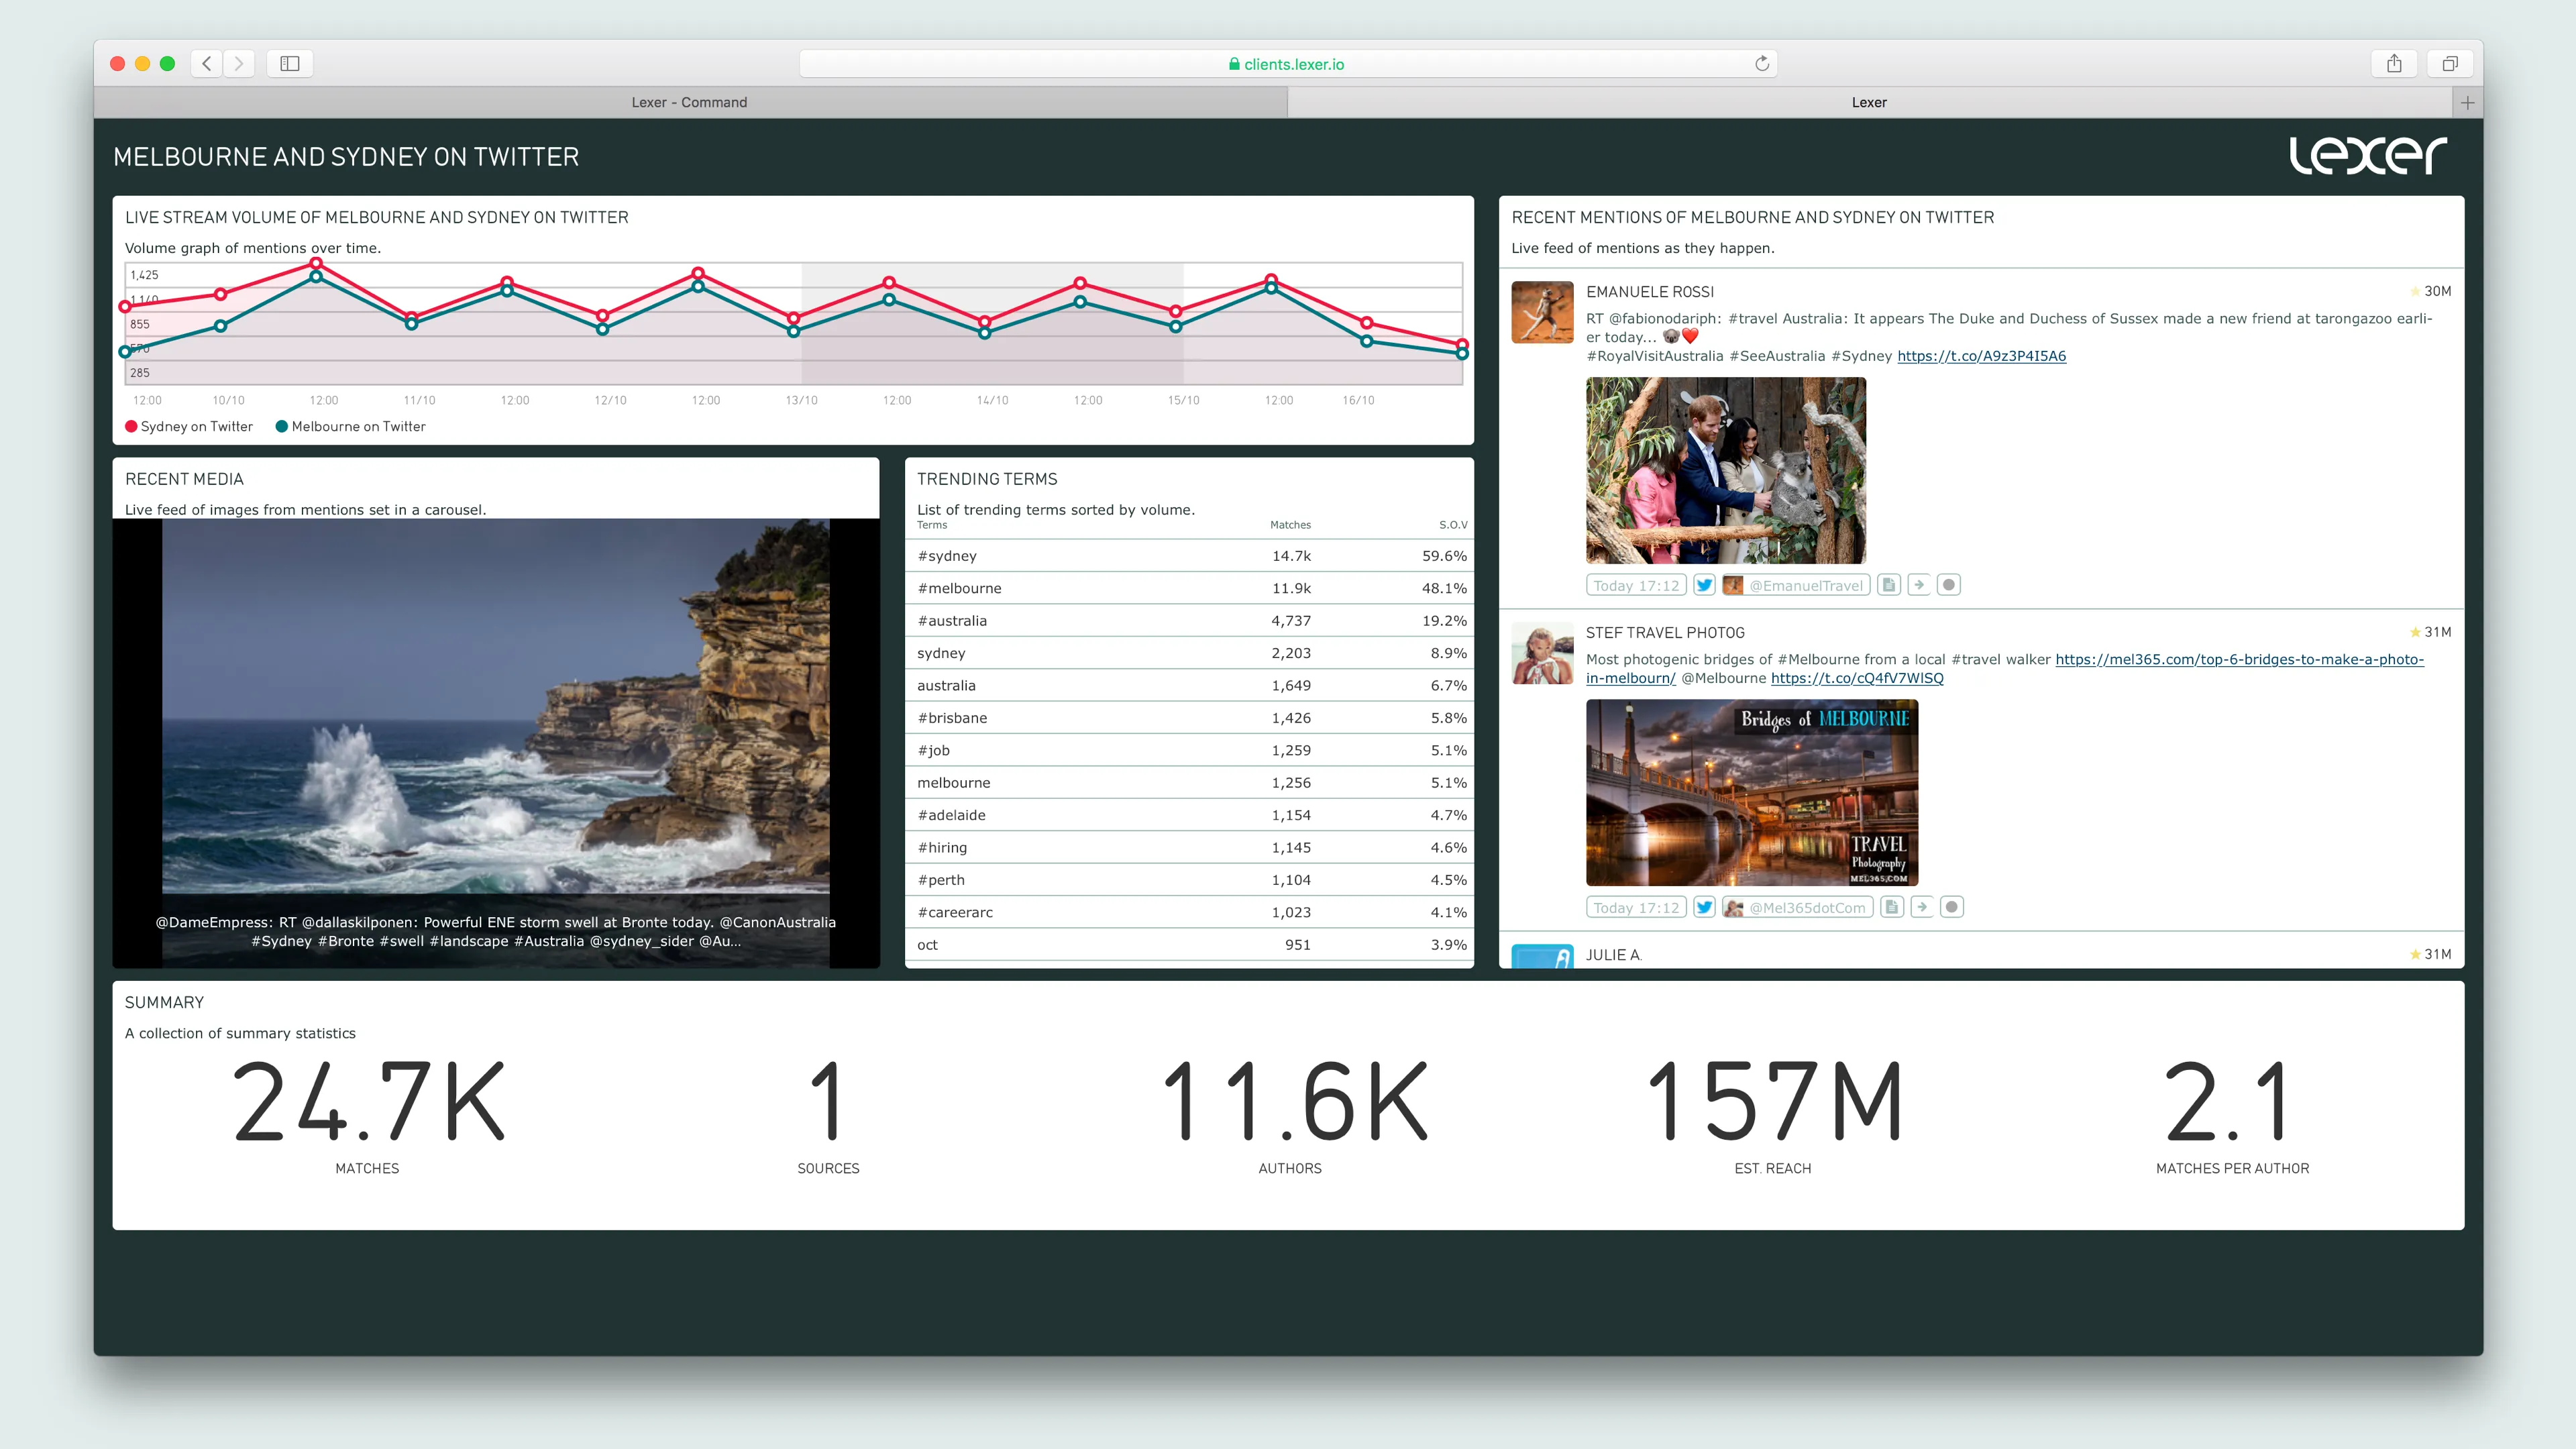
  • LIVE STREAM VOLUME - Volume graph of mentions over time.
  • TOP AUTHORS VOLUME - Graph of mentions by the top 5 authors by volume.
  • SOURCE VOLUME - Volume graph of sources sorted by volume.

2. Feed

  • RECENT MENTIONS - Live feed of mentions as they happen.
  • INFLUENTIAL MENTIONS - Live feed of mentions sorted by the influence of authors.

3. Count Charts

  • AUTHOR COUNT - Count of unique authors.
  • MENTION COUNT - Count of the number of mentions created.
  • SOURCE COUNT - Count of the number of unique sources.
  • AVERAGES MATCHES PER AUTHOR - Average number of mentions produced by each author.
  • TOTAL REACH - Estimated total reach of the total mentions.

4. Location Chart

  • MAP - Map of pins where content is being created.

5. Image Carousel

  • RECENT MEDIA - Live feed of images from mentions set in a carousel.

6. Strudel Chart

  • STATE STRUDEL - Percentage graph of all States.

7. Top Volume Charts

  • INFLUENTIAL AUTHORS - Influential authors sorted by reach.
  • ENGAGED AUTHORS - Engaged authors sorted by volume of content produced.
  • TRENDING TERMS - List of trending terms sorted by volume.
  • TOP SOURCES - List of the top sources sorted by volume.
  • SOURCE TYPES - List of the types of sources (e.g. Facebook comment, Tweet, Instagram Post etc) sorted by volume.
  • TOP SOURCE GROUPS - List of the top source groups sorted by volume.
  • TOP CLASSIFICATIONS - List of the top classifications sorted by volume.
  • TOP LINKS - List of the top shared links sorted by volume.
  • TOP LOCATIONS - List of locations sorted by the highest volume of mentions.

8. Volume Summary Chart

  • SUMMARY BAR - A collection of summary statistics.

How do you make a Visualize Screen?

Easy!

  • From the Lexer Hub, head over to Visualize, and hit New Screen.
  • You’ll need to give your screen a Name - this should be the thing you’re reporting on.
  • There’s an option to leave a Comment - this acts as an internal note, so should be something you’ll use to keep track (like the date), or if you perhaps want to put your name on it.
  • Hit Save, and you’re ready to get started.

Now you’re going to populate the screen with a selection of different charts and graphs from the list we just went through. So select New Chart to begin.

3840

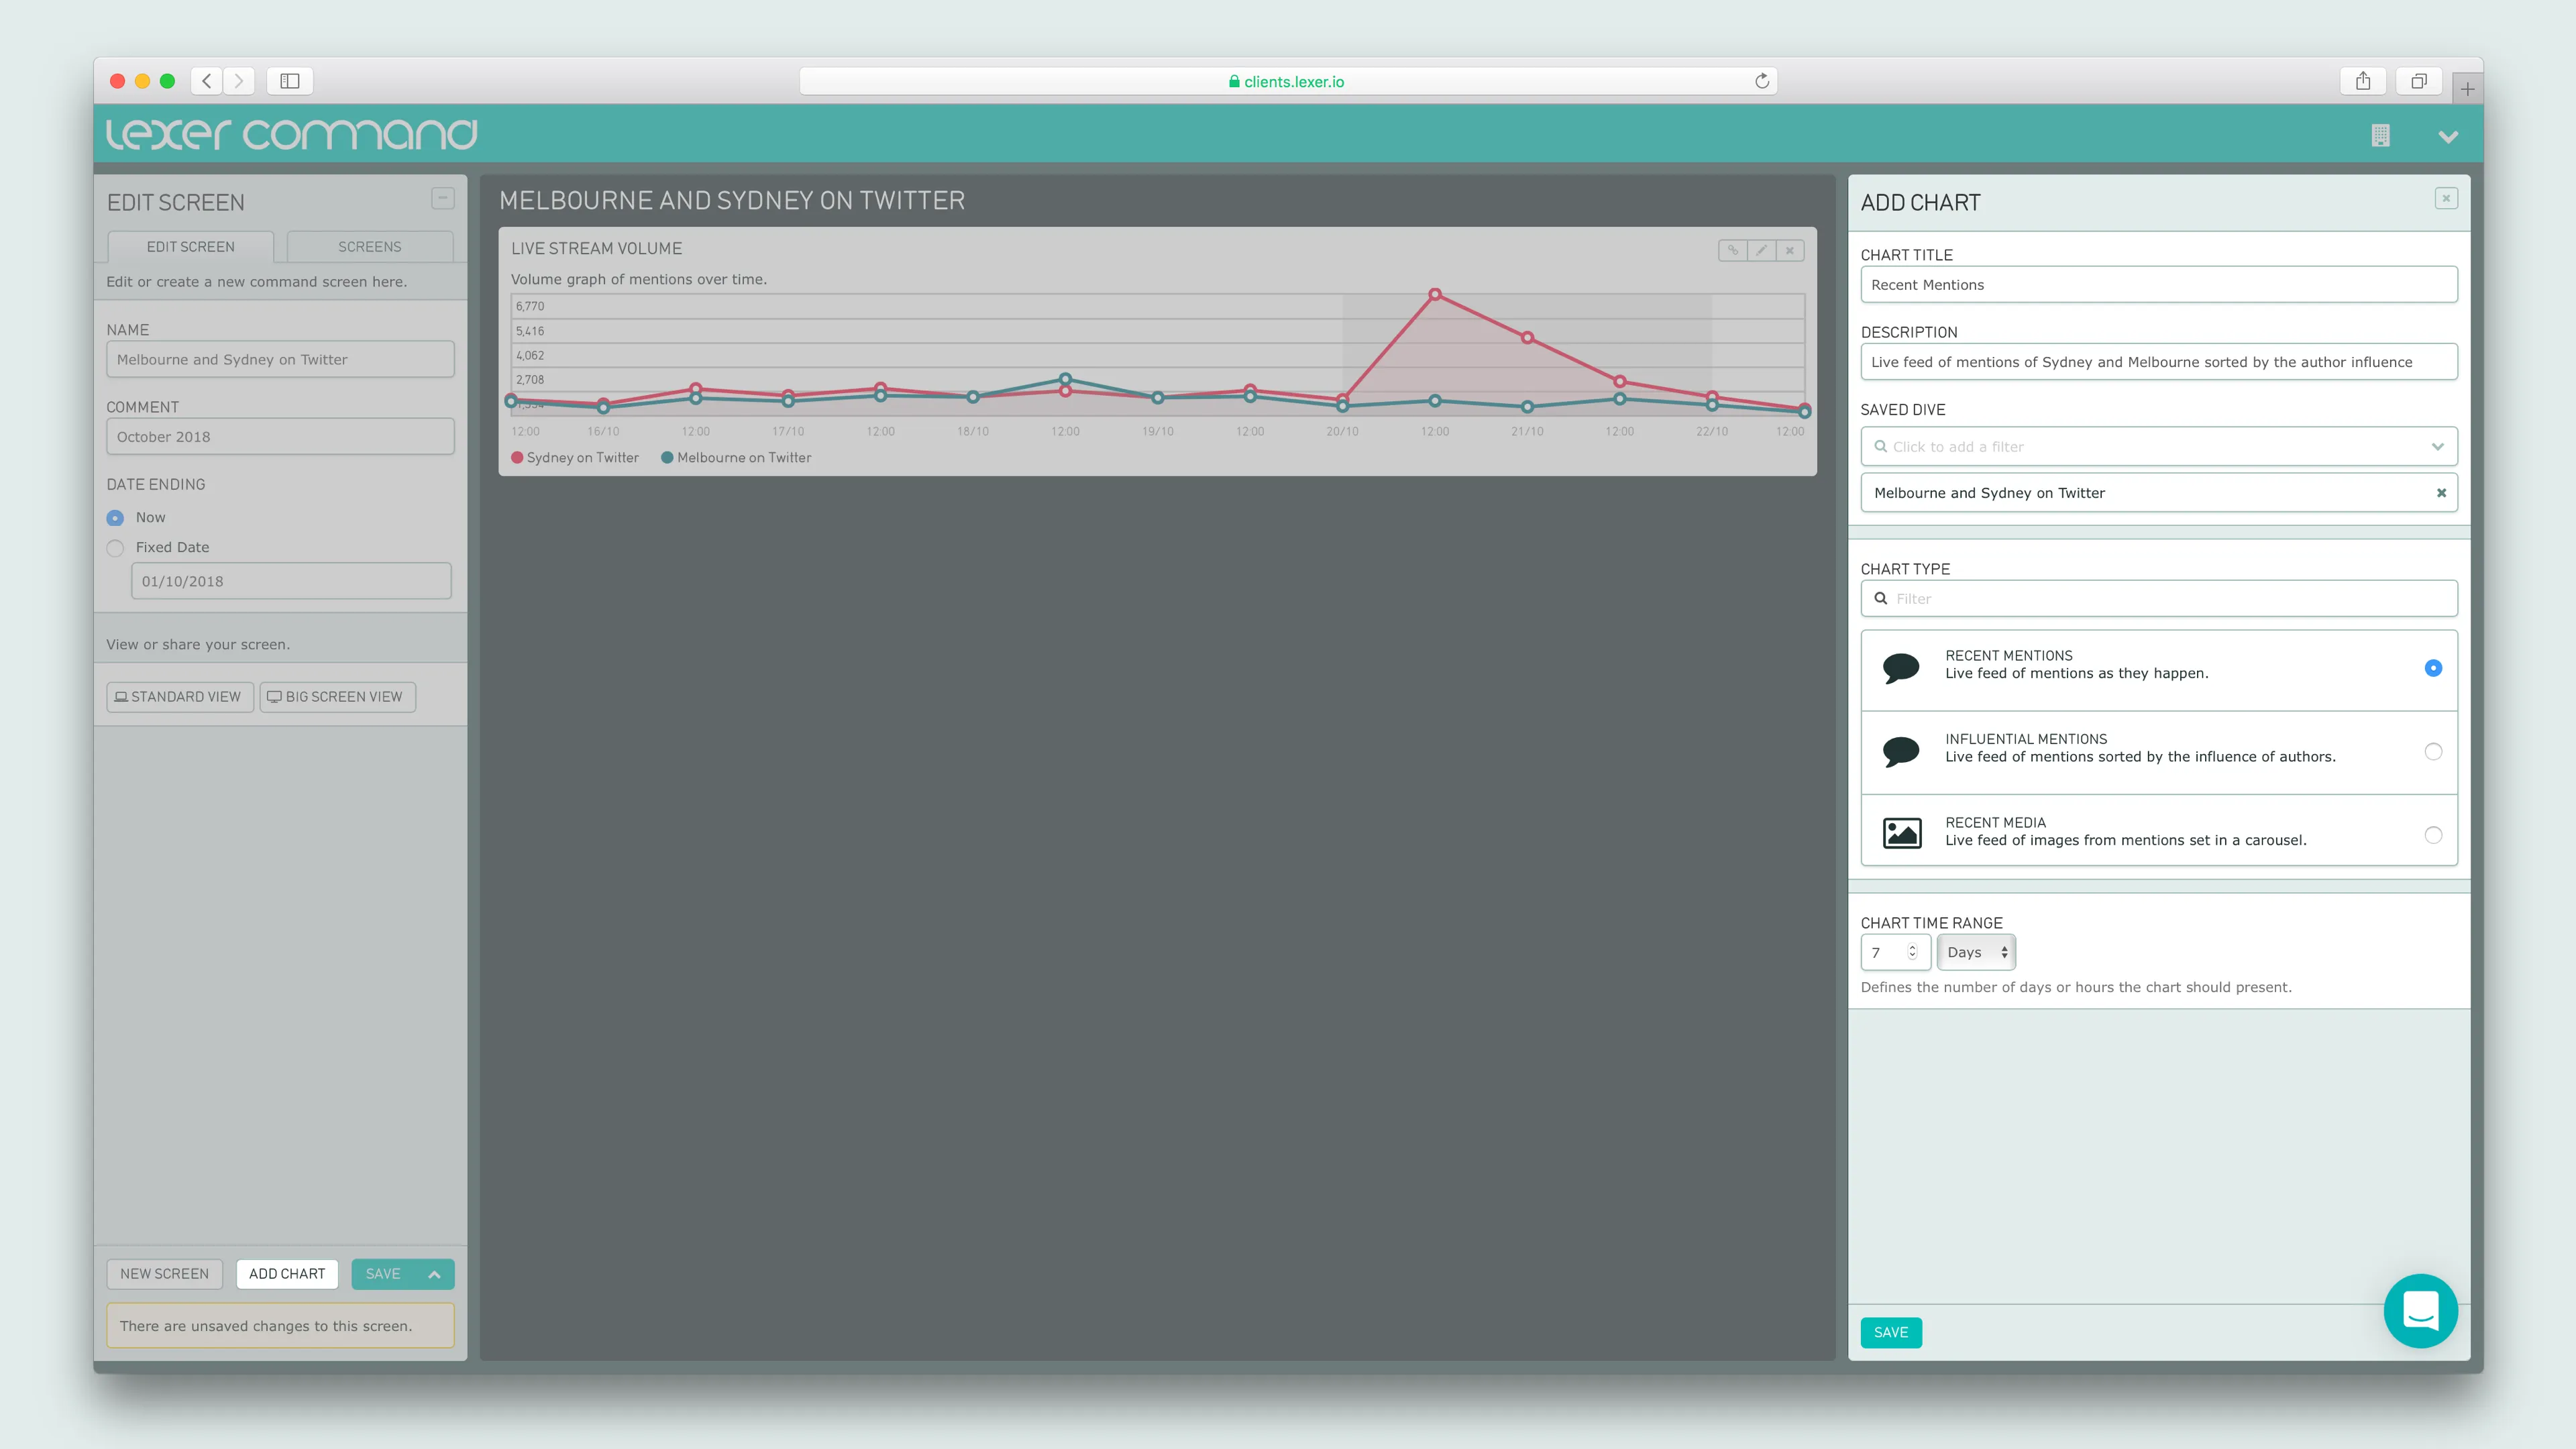
Your new chart will need:

  • A TITLE - The type of chart you’re showing.
  • A DESCRIPTION - An explanation of the data being displayed in this chart.
  • A SAVED DIVE - Select one of your pre-saved Dives from the dropdown menu.
  • CHART TYPE - Select how you’d like to display your data.
  • A DATE RANGE - The time frame you’d like to report on.

Hit Save, and your chart will be added to your screen.

You can then move it around just by clicking and dragging on the chart, and resize by pulling on the arrow in the bottom right corner.

When you’re done, hit Save again, and voilà - you’re done!

Troubleshooting Visualize

There was an error executing the search. Please try again.

There are a few possibilities as to what’s happening here:

  • Date: First of all, check your date range. If you’ve selected a date that’s in the future - no data will populate, and you’ll receive this error instead. Similarly, check that the date range doesn’t exceed 90 days. Lexer Listen, Respond, and Visualize all show content from the last 90 days. If you’d like to see data from beyond this date range, head into Activity, or reach out to Lexer Support (support@lexer.io) to discuss other options.
  • Saved dives: Head into Listen, and check that the Saved Dive/s powering your Visualize Screen are actually pulling in content, and make any necessary changes to them here, to ensure the results are relevant.
  • Save your work: If you’re testing the screen share view, Curate screen view, or API link view - first make sure you’ve saved your current screen.

Still having trouble? Please get in touch.

  • Lexer Support live chat in the Lexer platform.
  • Email Lexer Support (support@lexer.io).
Updated:
April 26, 2025
Did this page help you?
Thank you! Your feedback has been received!
Oops! Something went wrong while submitting the form, for assistance please contact support@lexer.io
Welcome to Lexer!
Fundamentals
Getting started
Javascript Tag basics
Data Platform
Javascript Tag
Data in the CDXP
Fundamentals
Getting started
Our glossary
Fundamentals
Getting started
Integrations overview
Fundamentals
Integrations
Onboarding data with Lexer
Data Platform
Data Onboarding
Data onboarding process
Data Platform
Data Onboarding
Importing CSV data
Data Platform
Data Onboarding
Importing JSON data
Data Platform
Data Onboarding
Secure file uploads
Data Platform
Data Onboarding
SFTP uploads and exports
Data Platform
Data Onboarding
AWS S3 uploads and exports
Data Platform
Data Onboarding
Lexer's attributes
Data Platform
Data Types
Predictive attributes
Data Platform
Data Types
Lexer API overview
Data Platform
Developer APIs
Understanding APIs
Data Platform
Developer APIs
API authentication
Data Platform
Developer APIs
API rate limits
Data Platform
Developer APIs
Bulk write API
Data Platform
Developer APIs
Profile read API
Data Platform
Developer APIs
Activity overview
Insights
Activity
Team report
Insights
Activity
Cases report
Insights
Activity
NPS report
Insights
Activity
Listen overview
Insights
Listen
Searching in Listen
Insights
Listen
Tier filters
Insights
Listen
Saved dives
Insights
Listen
Boolean search
Insights
Listen
Listen CSV exports
Insights
Listen
Visualize overview
Insights
Visualize
Curate image feed
Insights
Visualize
Respond overview
Engagement
Respond
Identity Resolution
Fundamentals
Getting started
My account
Fundamentals
Setup
Manage team
Fundamentals
Setup
Group permissions
Fundamentals
Setup
Classifications
Fundamentals
Setup
Out of the box segments
Fundamentals
Setup
Lexi your AI companion
Fundamentals
Getting started
Browser guide
Fundamentals
Security
Corporate networks
Fundamentals
Security
Multi-factor authentication
Fundamentals
Security
Single sign-on
Fundamentals
Security
Lexer's ultimate troubleshooting guide
Fundamentals
Troubleshooting
Troubleshooting tech issues
Fundamentals
Troubleshooting
Troubleshooting integrations
Fundamentals
Troubleshooting
Troubleshooting Activate
Fundamentals
Troubleshooting
Troubleshooting Respond
Fundamentals
Troubleshooting
Help! My data is missing from the Hub
Fundamentals
Troubleshooting
Lexer data specification
Data Platform
Data Specification
Customer data specification
Data Platform
Data Specification
Commerce data specification
Data Platform
Data Specification
Marketing data specification
Data Platform
Data Specification
Compliance data specification
Data Platform
Data Specification
Data formatting and validation
Data Platform
Data Specification
Product imagery
Data Platform
Data Specification
Currency conversion
Data Platform
Data Specification
Dataset management
Data Platform
Data Management
Getting started with Logs
Data Platform
Data Management
Respond chatbot API
Data Platform
Developer APIs
Activity API
Data Platform
Developer APIs
Lexer Forms overview
Data Platform
Forms
Form builder workflow
Data Platform
Forms
Form conditional logic
Data Platform
Forms
Form settings
Data Platform
Forms
Form segmentation
Data Platform
Forms
Form response analysis
Data Platform
Forms
Hidden form fields
Data Platform
Forms
Javascript Tag technical guide
Data Platform
Javascript Tag
Javascript Tag use cases
Data Platform
Javascript Tag
Javascript Tag: Shopify Custom Pixel
Data Platform
Javascript Tag
CRM data
Data Platform
Data Types
Transaction data
Data Platform
Data Types
Email engagement data
Data Platform
Data Types
Experian data enrichment
Data Platform
Data Types
Customer Service data
Data Platform
Data Specification
GDPR and CCPA requests
Fundamentals
Compliance
File upload API
Data Platform
Developer APIs
Segment overview
Insights
Segment
Creating segments
Insights
Segment
Smart Search
Insights
Segment
Profile tab
Insights
Segment
Event Explorer
Insights
Segment
Attribute value types
Data Platform
Data Types
Compare segments
Insights
Compare
Compare attributes
Insights
Compare
Activate overview
Engagement
Activate
Segment activations
Engagement
Activate
Event activations
Engagement
Activate
Activation field mapping
Engagement
Activate
Audience splits
Engagement
Activate
A/B splits
Engagement
Activate
Control group splits
Engagement
Activate
Inbox filtering
Engagement
Respond
Ignored Senders
Engagement
Respond
Forms in Respond
Engagement
Respond
Workflow states
Engagement
Respond
Bulk changes
Engagement
Respond
Scheduled replies
Engagement
Respond
Message templates
Engagement
Respond
Finding conversations
Engagement
Respond
Customer profiles
Engagement
Respond
Grouped messages
Engagement
Respond
Automation rules
Engagement
Respond
Redact messages
Engagement
Respond
Routing customer replies
Engagement
Respond
Interact with comments
Engagement
Respond
Respond workflow tips
Engagement
Respond
Contact Reporting
Engagement
Contact
Contact Queue Filters
Engagement
Contact
Contact WhatsApp Queues
Engagement
Contact
Schedule overview
Engagement
Schedule
Serve overview
Engagement
Serve
Installing Serve
Engagement
Serve
Serve user management
Engagement
Serve
Forms in Serve
Engagement
Serve
Configuring Serve
Engagement
Serve
Serve reports
Engagement
Serve
Serve Currency
Engagement
Serve
Serve POS QR Code
Engagement
Serve
Activate CSV export
Engagement
Activate
Track overview
Insights
Track
Track Tables
Insights
Track
Report overview
Measure
Listen
Lexer Product Recommender → Klaviyo Integration
Grow
Lexer Product Recommender → Klaviyo Integration
Where do your best customers live? Use geographic insights to maximize media spend and conversion
Grow
Where do your best customers live? Use geographic insights to maximize media spend and conversion
Suppression audiences: How to use them and maximize your media effectiveness
Enrich
Suppression audiences: How to use them and maximize your media effectiveness
Measure campaign effectiveness: Track your KPIs and report on campaign performance
Enrich
Measure campaign effectiveness: Track your KPIs and report on campaign performance
Converting prospects: Acquire customers from your current, engaged prospect base (and save your ad spend!)
Acquire
Converting prospects: Acquire customers from your current, engaged prospect base (and save your ad spend!)
Understanding customer intent: Effective message personalization for buyers who shop outside their gender
Grow
Understanding customer intent: Effective message personalization for buyers who shop outside their gender
Deepen customer understanding: Use third-party data to identify insights for personalized messaging and increased engagement
Grow
Deepen customer understanding: Use third-party data to identify insights for personalized messaging and increased engagement
Basket analysis: Increasing customer lifetime value through targeted product bundling
Grow
Basket analysis: Increasing customer lifetime value through targeted product bundling
Persona building: Personalize your messaging for maximum return on your campaign investments
Grow
Persona building: Personalize your messaging for maximum return on your campaign investments
Driving customer loyalty: Identify, keep, and grow your most loyal customers
Retain
Driving customer loyalty: Identify, keep, and grow your most loyal customers
Increasing customer lifetime value: Upselling strategies
Grow
Increasing customer lifetime value: Upselling strategies
Reactivating lapsed customers: Retention and growth
Retain
Reactivating lapsed customers: Retention and growth
Welcome offer strategies: Using the Hub for analysis
Acquire
Welcome offer strategies: Using the Hub for analysis
Creating customer forms: Best practices
Enrich
Creating customer forms: Best practices
Connecting your MarTech stack with Lexer!
Enrich
Connecting your MarTech stack with Lexer!
Identifying win-back customers using the Second Last Order: Date attribute
Retain
Identifying win-back customers using the Second Last Order: Date attribute
Understanding customers' purchasing habits: Order Sequence filter
Grow
Understanding customers' purchasing habits: Order Sequence filter
Maximizing customer communications in Respond
Retain
Maximizing customer communications in Respond
Using Product Recommendation in the Hub to encourage repeat purchases
Grow
Using Product Recommendation in the Hub to encourage repeat purchases
Encouraging customer loyalty using birthday campaigns
Retain
Encouraging customer loyalty using birthday campaigns
Increasing customer lifetime value: Converting your one-time buyers into two-time buyers
Grow
Increasing customer lifetime value: Converting your one-time buyers into two-time buyers
Collecting zero-party data using Lexer Forms
Enrich
Collecting zero-party data using Lexer Forms
Measuring your data over time with Track
Enrich
Measuring your data over time with Track
UTM Creation Guidelines
Brand Assets
Brand Assets
Brand Assets
GTM guide to creating marketing materials with Lexer
How to use the Lexer Form Builder
Explore our standard integrations
Operating a CDP Practice LP
LP Sales Enablement
LP Sales Enablement
LP Sales Enablement
Video Training Courses LP
Purpose and Mission
Purpose and Mission
Purpose and Mission
Brand & Marketing LP
Stage 3 - QBRs and Customer insights
Client Onboarding Journey
Start your CDP Practice
Lexer Messaging
Lexer Messaging
Lexer Messaging
Pain point conversations
Lexer Ideal Customer Profile & Positioning
Referral Partner Program Overview
Demo Hub Guide
Demo Hub Guide
Demo Hub Guide