Track Event Tables

Event Tables let you save and share event-based analyses—so you can revisit them, track changes, and easily report on customer behavior.

They’re built using the same powerful filters and charts available in Event Explorer, but with one key difference: you can save your setup and return to it at any time. Each table includes your selected customer segment, event type, filters, and layout—ready to reload, edit, or export.

You’ll find Event Tables in the Track > Tables area, sitting alongside your Metric Tables. The key difference?

  • Metric Tables start tracking from the moment you configure them
  • Event Tables let you analyse all historical data available in your CDP

Together, they give you flexible ways to explore trends, report on performance, and answer detailed customer questions—all from your event data.

In this article

Saving an Event Table

You can create an Event Table in two ways—either from Event Explorer or directly in the Track > Tables area.

Option 1: From Event Explorer

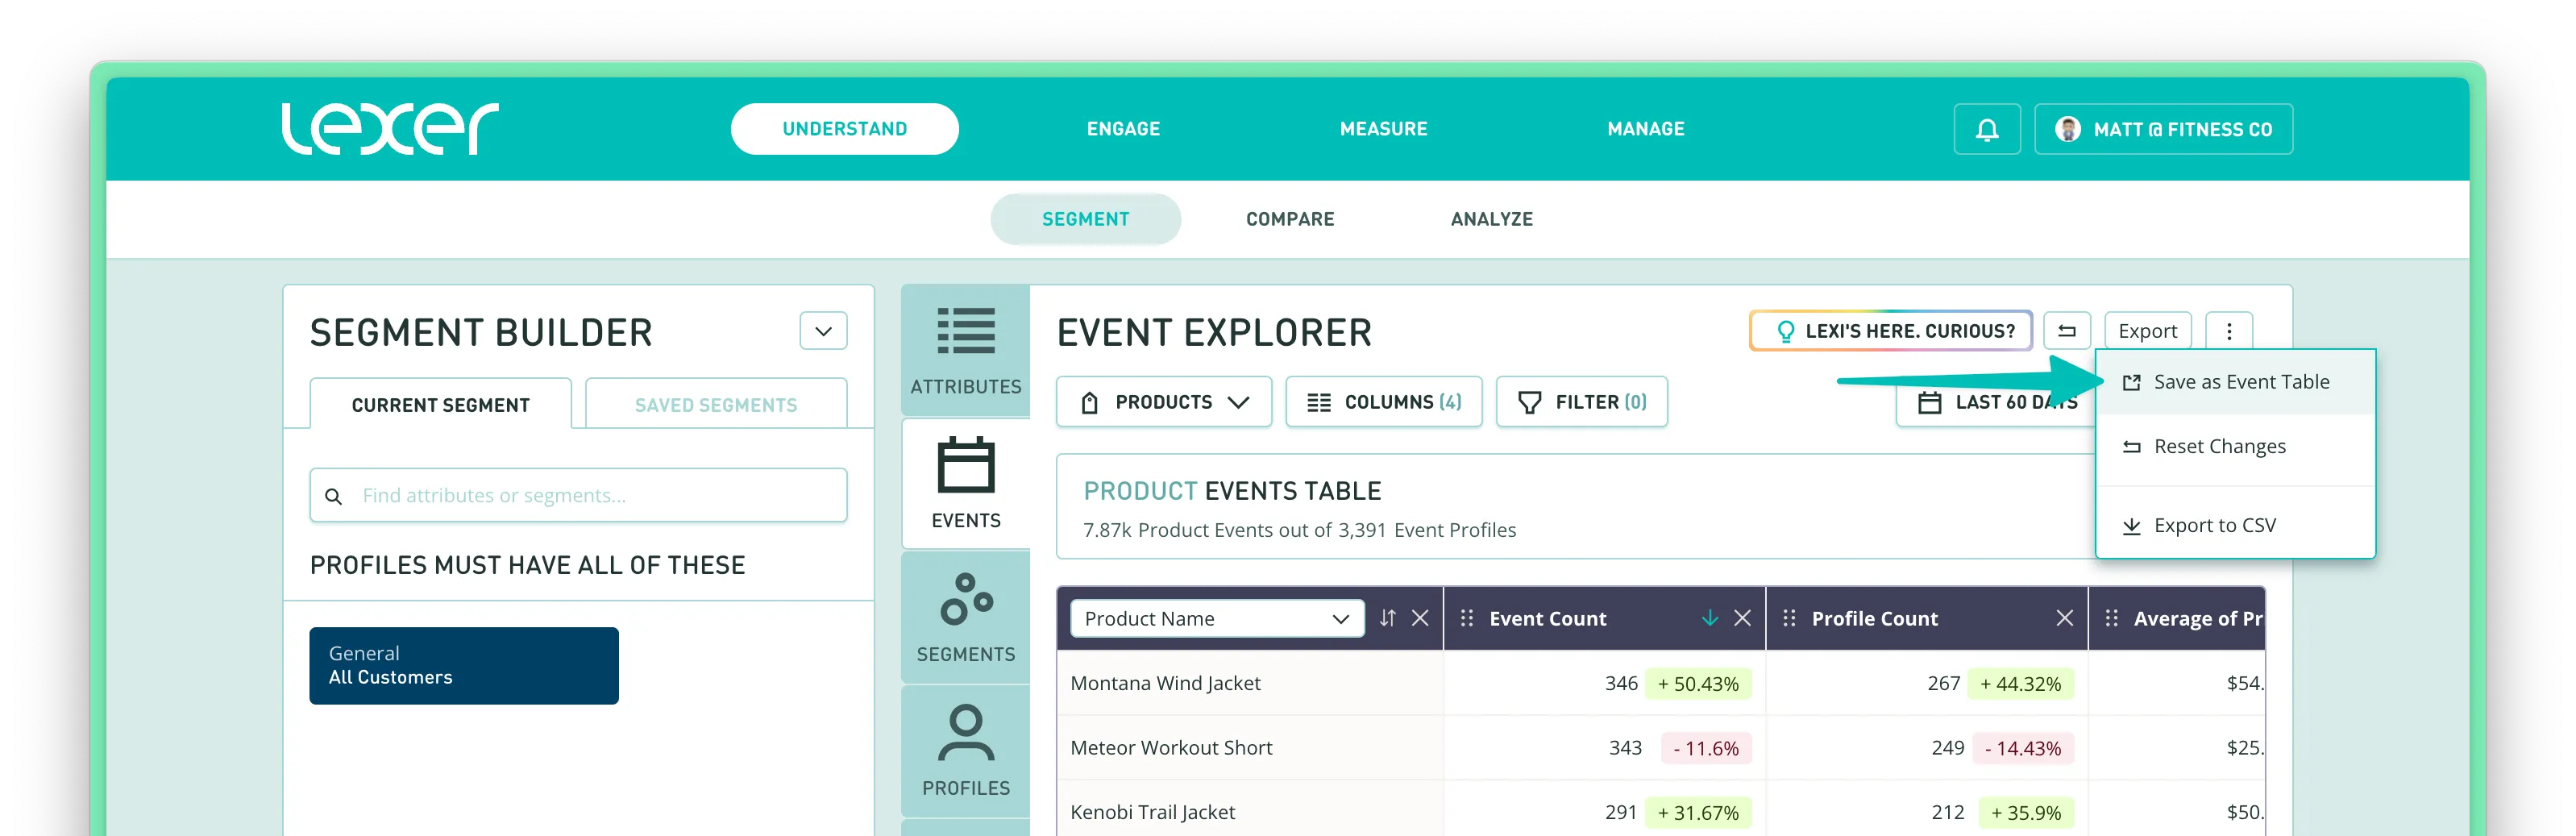
Once you’ve built an event analysis in Understand > Segment > Events, click the Save as Event Table button at the top of the screen. You’ll be prompted to name your table, then given the option to view it in Track.

Create a new event table in Segment

Option 2: From Track

Head to Measure > Track > Tables and click + New Table. Then choose Event Table and configure your analysis from there.

Create a new event table in Track

Duplicating an existing Event Table

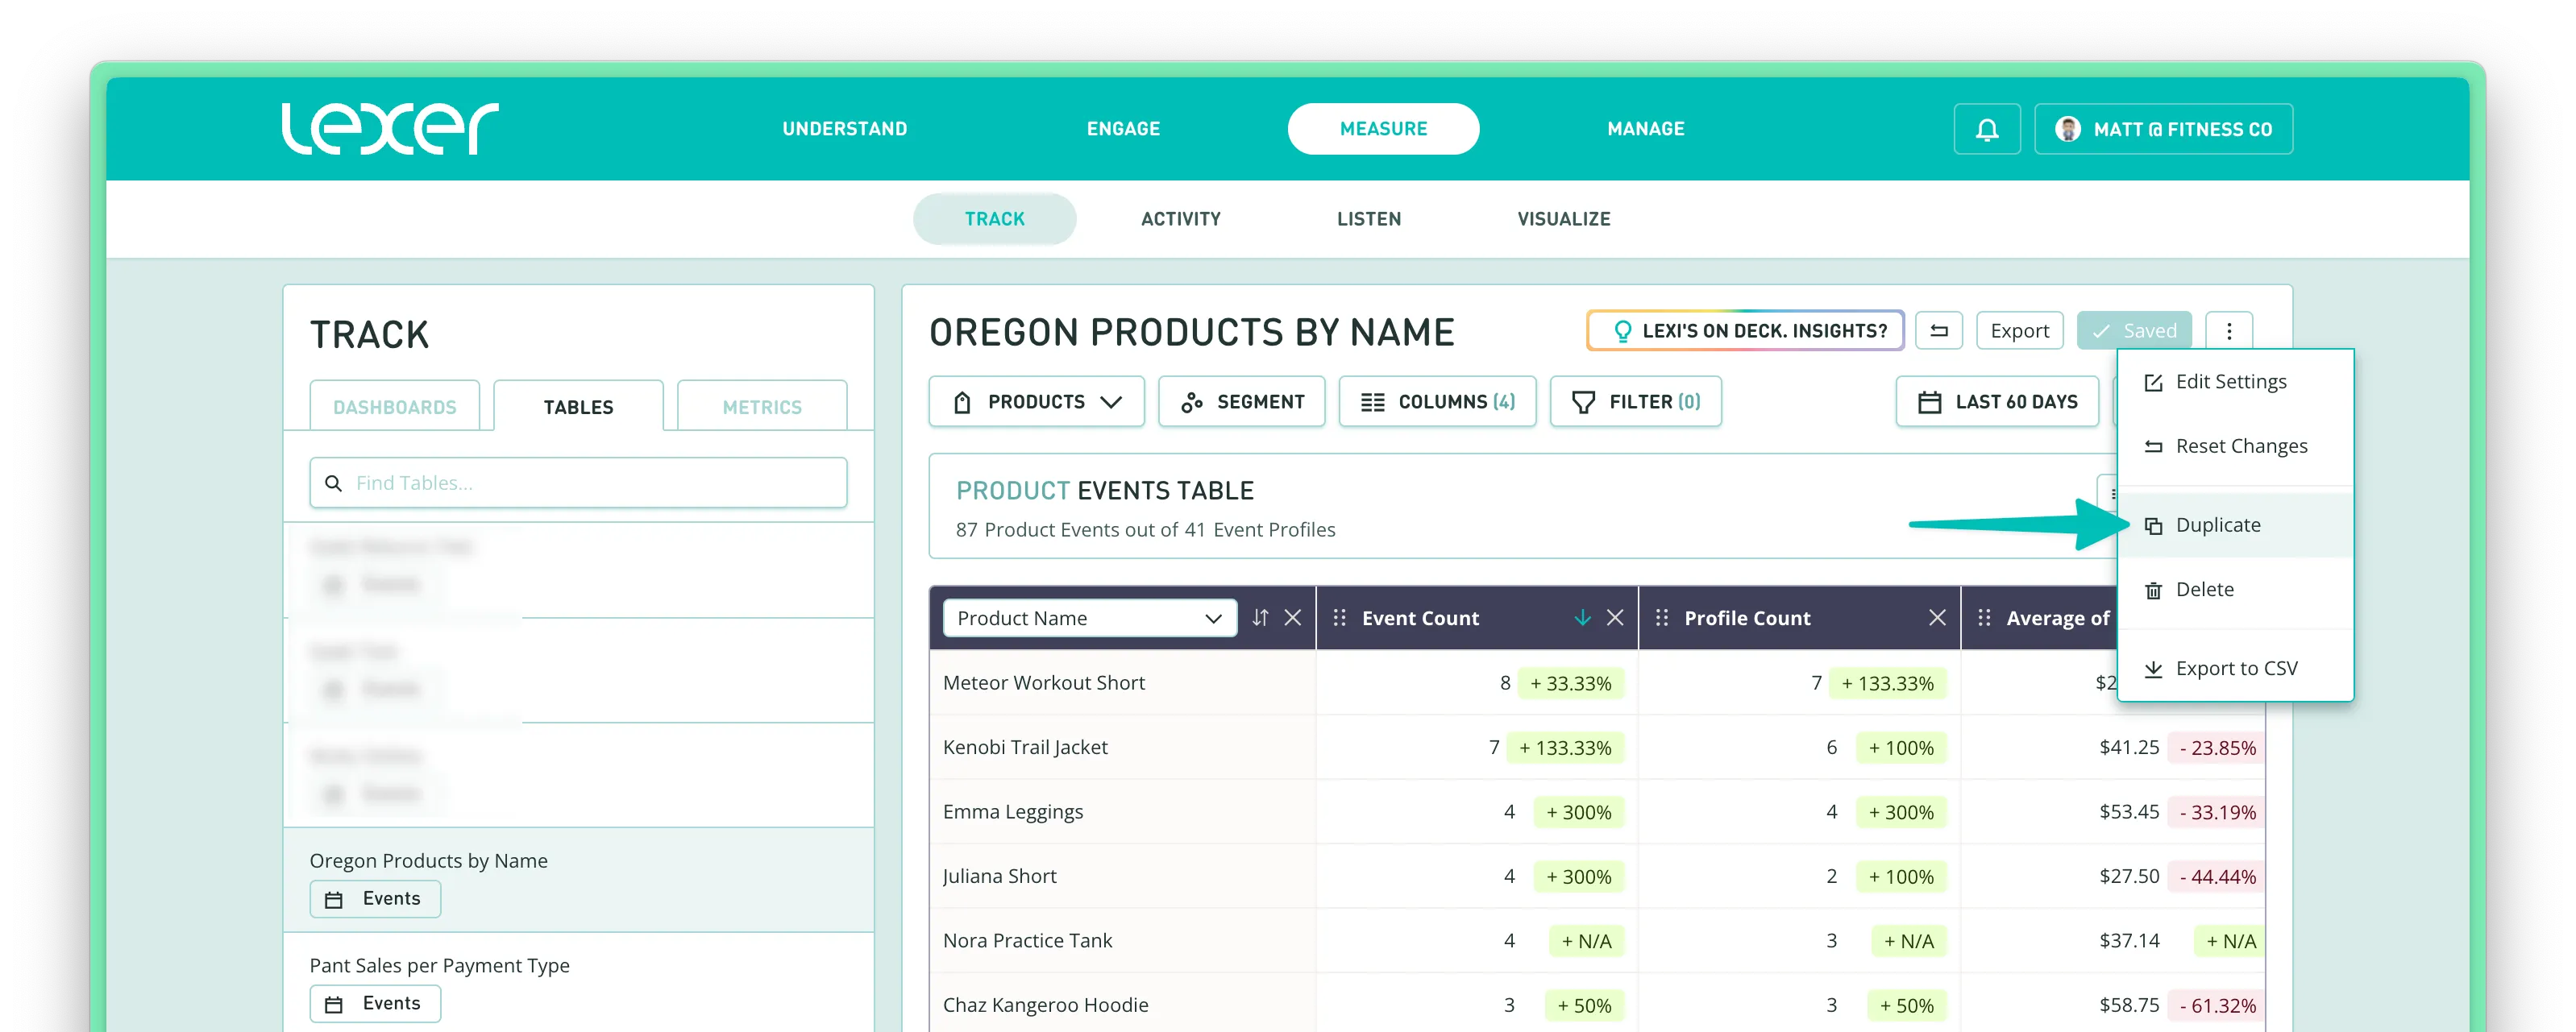
To copy an existing table, open it from Track > Tables, then click the ••• menu in the top right and select Duplicate. This is useful when you want to create similar views for different segments, products, or timeframes.

Duplicate an existing event table

Configuring Your Table Layout

Once you’ve saved your Event Table, you can customize how it looks by choosing the rows, columns, and metrics that matter most.

Choose your rows

Rows control how your data is grouped. Use the dropdown in the top-left of the table to select a field from your chosen event—like product name, category, store location, or any other event field.

Configure your table rows

Add your columns

Columns define which metrics appear in the table.

Click Columns, then:

  1. Choose an event field (e.g. price paid, quantity).
  2. Choose a metric (e.g. total, average, count).

You can add multiple columns to compare different metrics side-by-side.

Configure your table columns

Filtering and Display Options

Event Tables use the same flexible filters and chart types as Event Explorer, making it easy to focus on the customers, events, and timeframes that matter to you.

Choose your event

Each table focuses on a single event—like order, product purchased, or return. Start by selecting your event from the dropdown. This sets the context for the filters, rows, and metrics that follow.

Filter by customer segment

Apply filters from the Segment Builder to narrow your table to a specific group of customers—like loyal shoppers, high spenders, or first-time buyers. You don’t need to save the segment first—just build your filters and they’ll be saved with the table.

Filter by event fields

Refine your table by filtering on specific event-level properties—such as product category, store location, payment method, or any custom field available in your data.

Filter by date range

Adjust the start and end dates to focus your table on a specific period—like the past week, a recent campaign, or a full financial year.

Choose your display type

Once your table is set up, pick the view that best tells the story:

  • Metrics – big summary numbers, great for totals and quick comparisons
  • Time series – line charts showing changes over time
  • Bar chart – horizontal bars comparing values across rows (e.g. product sales or store visits)

Switch between views using the controls above your table.

Export to CSV

Need to share your analysis or dig deeper in Excel? You can export any Event Table to CSV with just a click.

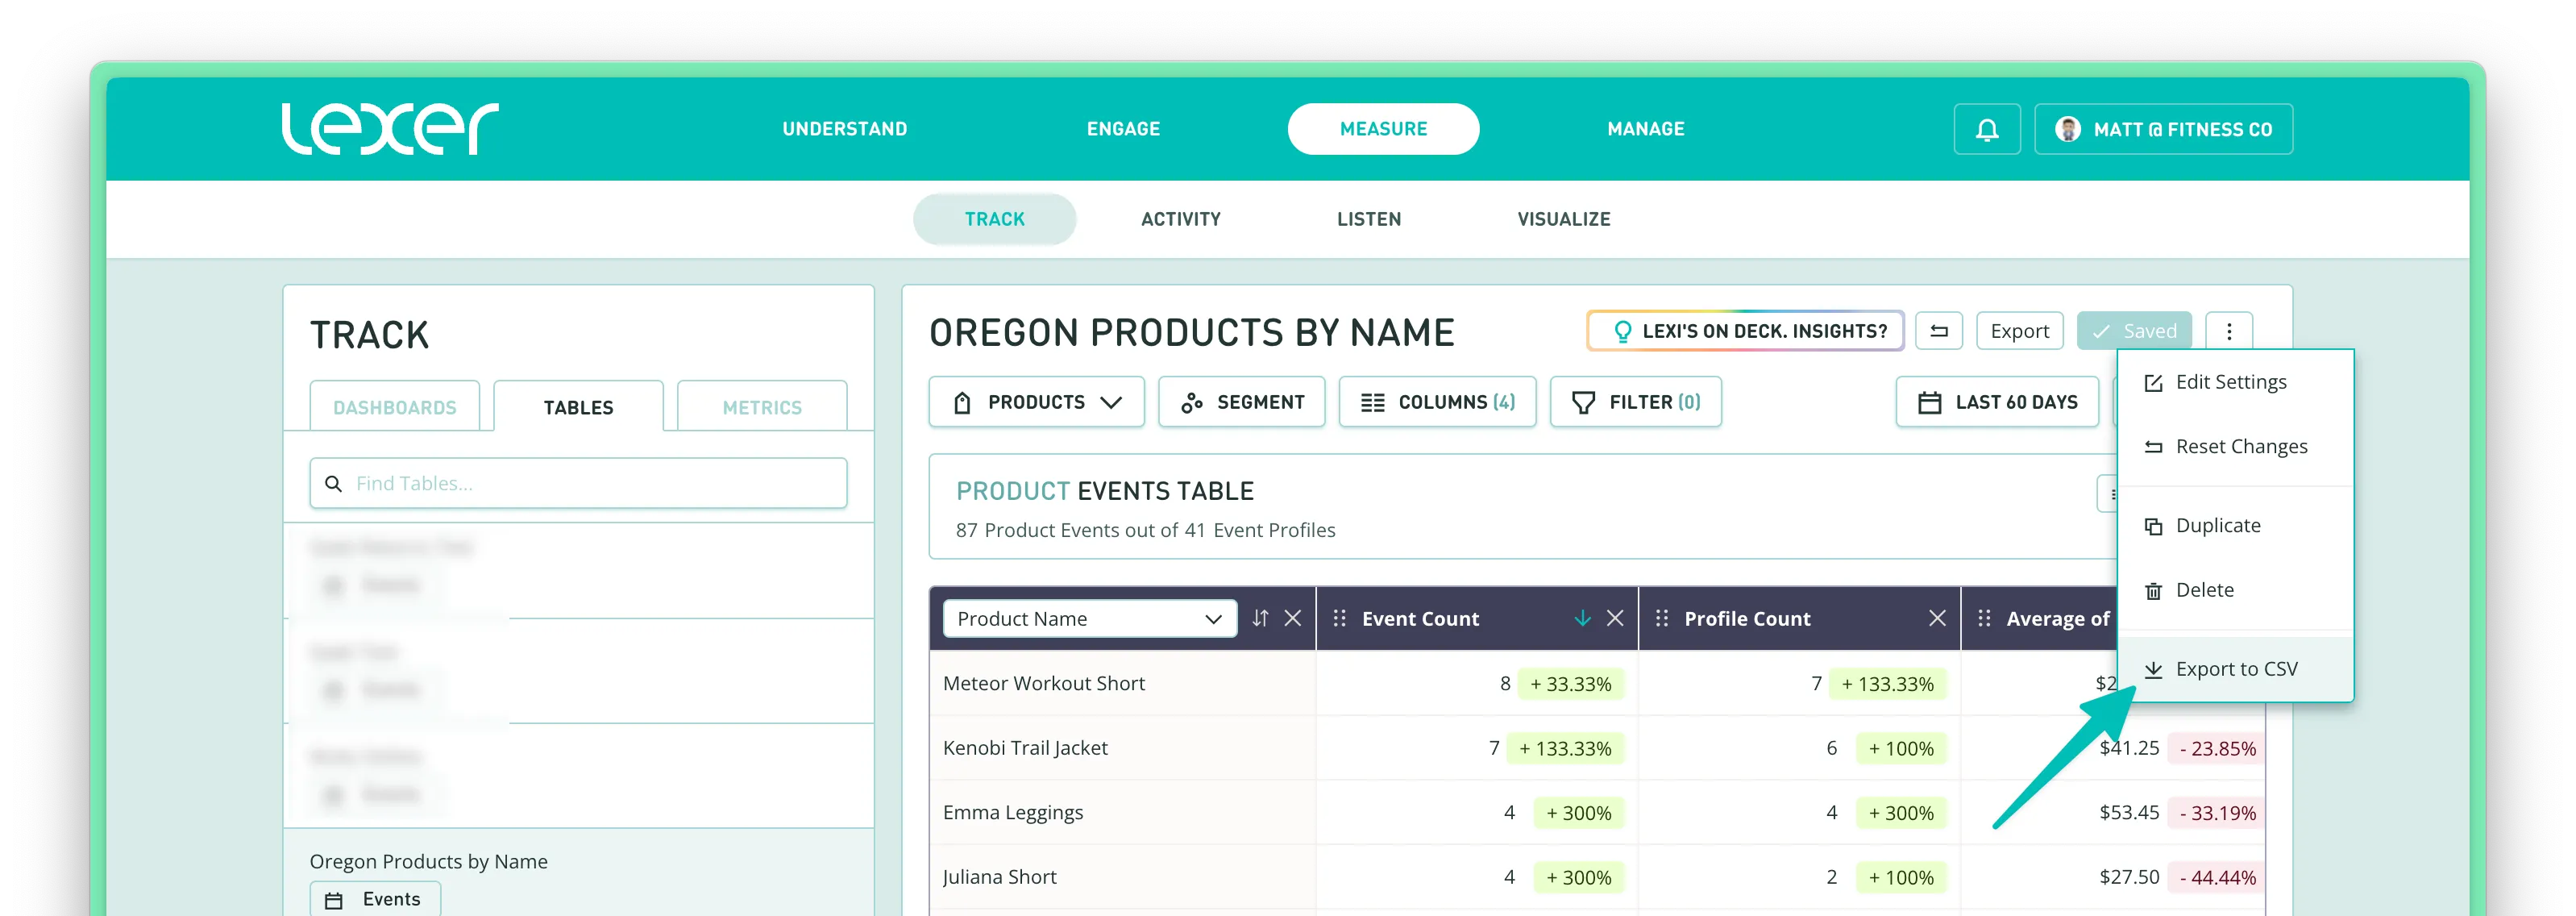
In the top-right corner of the Event Table, open the ••• menu and select Export to CSV. This will download a file containing exactly what’s shown in your table—your selected rows, columns, and filters.

Export your table data to CSV

Event Tables vs Metric Tables: What’s the Difference?

You’ll find both Event Tables and Metric Tables in Track > Tables, but they serve different purposes.

Feature Event Tables Metric Tables
Use case Ad hoc analysis of customer events Ongoing tracking of key performance metrics
Data coverage Includes all historical event data in your CDP Starts tracking from the day you create the metric
Data structure Flexible rows and columns based on event fields Single number per metric per time period
Filters Full segment, event, and attribute filtering Segment filters only
Visuals Table, bar chart, line chart, and summary metrics Line chart or single number
Best for... Deep dives, comparisons, and campaign reporting Trend monitoring, dashboards, and KPIs

When to use each one:

  • Use Event Tables when you want to explore behavior across your full history—like “What were the top 10 purchased products last quarter?”
  • Use Metric Tables to track KPIs going forward—like “Average total spend for VIPs this month vs last.”

FAQ's

Do I need to save a segment before creating an Event Table?

No. You can build your segment filters directly in the Segment Builder, and they’ll be saved with the table - no need to create or save a new segment first.

Can I edit a saved Event Table?

Yes. Open the table in Track > Tables, make your changes (e.g. filters, layout, date range), and click Save.

Can I duplicate an Event Table?

Absolutely. Use the ••• menu in the top-right corner of any table and select Duplicate. This is handy when you want to tweak a table for different segments or date ranges without starting from scratch.

What’s the difference between Event Tables and Metric Tables?

Event Tables give you a flexible view of historical event data across any time range. Metric Tables are designed to track performance from the moment you create them, with one metric per row. See the comparison table above for more detail.

Can I export my table data?

Yes. From the ••• menu, select Export to CSV. This gives you a downloadable file with your table’s current layout—great for reporting or offline analysis.

Updated:
September 8, 2025
Did this page help you?
Thank you! Your feedback has been received!
Oops! Something went wrong while submitting the form, for assistance please contact support@lexer.io
Welcome to Lexer!
Fundamentals
Getting started
Javascript Tag basics
Data Platform
Javascript Tag
Data in the CDXP
Fundamentals
Getting started
Our glossary
Fundamentals
Getting started
Integrations overview
Fundamentals
Integrations
Onboarding data with Lexer
Data Platform
Data Onboarding
Data onboarding process
Data Platform
Data Onboarding
Importing CSV data
Data Platform
Data Onboarding
Importing JSON data
Data Platform
Data Onboarding
Secure file uploads
Data Platform
Data Onboarding
SFTP uploads and exports
Data Platform
Data Onboarding
AWS S3 uploads and exports
Data Platform
Data Onboarding
Lexer's attributes
Data Platform
Data Types
Predictive attributes
Data Platform
Data Types
Lexer API overview
Data Platform
Developer APIs
Understanding APIs
Data Platform
Developer APIs
API authentication
Data Platform
Developer APIs
API rate limits
Data Platform
Developer APIs
Profile read API
Data Platform
Developer APIs
Activity overview
Insights
Activity
Team report
Insights
Activity
Cases report
Insights
Activity
NPS report
Insights
Activity
Listen overview
Insights
Listen
Searching in Listen
Insights
Listen
Tier filters
Insights
Listen
Saved dives
Insights
Listen
Boolean search
Insights
Listen
Listen CSV exports
Insights
Listen
Visualize overview
Insights
Visualize
Curate image feed
Insights
Visualize
Respond overview
Engagement
Respond
Identity Resolution
Fundamentals
Getting started
My account
Fundamentals
Setup
Manage team
Fundamentals
Setup
Group permissions
Fundamentals
Setup
Classifications
Fundamentals
Setup
Out of the box segments
Fundamentals
Setup
Lexi AI
Fundamentals
Getting started
Browser guide
Fundamentals
Security
Corporate networks
Fundamentals
Security
Multi-factor authentication
Fundamentals
Security
Single sign-on
Fundamentals
Security
Lexer's ultimate troubleshooting guide
Fundamentals
Troubleshooting
Troubleshooting tech issues
Fundamentals
Troubleshooting
Troubleshooting integrations
Fundamentals
Troubleshooting
Troubleshooting Activate
Fundamentals
Troubleshooting
Troubleshooting Respond
Fundamentals
Troubleshooting
Help! My data is missing from the Hub
Fundamentals
Troubleshooting
Lexer data specification
Data Platform
Data Specification
Customer data specification
Data Platform
Data Specification
Commerce data specification
Data Platform
Data Specification
Marketing data specification
Data Platform
Data Specification
Compliance data specification
Data Platform
Data Specification
Data formatting and validation
Data Platform
Data Specification
Product imagery
Data Platform
Data Specification
Currency conversion
Data Platform
Data Specification
Dataset management
Data Platform
Data Management
Getting started with Logs
Data Platform
Data Management
Respond chatbot API
Data Platform
Developer APIs
Activity API
Data Platform
Developer APIs
Lexer Forms overview
Data Platform
Forms
Form builder workflow
Data Platform
Forms
Form conditional logic
Data Platform
Forms
Form settings
Data Platform
Forms
Form segmentation
Data Platform
Forms
Form response analysis
Data Platform
Forms
Form hidden fields
Data Platform
Forms
Form attribute mapping
Data Platform
Forms
Javascript Tag technical guide
Data Platform
Javascript Tag
Javascript Tag use cases
Data Platform
Javascript Tag
Javascript Tag: Shopify Custom Pixel
Data Platform
Javascript Tag
CRM data
Data Platform
Data Types
Transaction data
Data Platform
Data Types
Email engagement data
Data Platform
Data Types
Experian data enrichment
Data Platform
Data Types
Customer Service data
Data Platform
Data Specification
GDPR and CCPA requests
Fundamentals
Compliance
File upload API
Data Platform
Developer APIs
Segment overview
Insights
Segment
Creating segments
Insights
Segment
Smart Search
Insights
Segment
Profile tab
Insights
Segment
Event Explorer
Insights
Segment
Attribute value types
Data Platform
Data Types
Compare segments
Insights
Compare
Compare attributes
Insights
Compare
Activate Overview
Engagement
Activate
Segment activations
Engagement
Activate
Event activations
Engagement
Activate
Activation field mapping
Engagement
Activate
Audience splits
Engagement
Activate
A/B splits
Engagement
Activate
Control group splits
Engagement
Activate
Inbox filtering
Engagement
Respond
Ignored Senders
Engagement
Respond
Forms in Respond
Engagement
Respond
Workflow states
Engagement
Respond
Bulk changes
Engagement
Respond
Scheduled replies
Engagement
Respond
Message templates
Engagement
Respond
Finding conversations
Engagement
Respond
Customer profiles
Engagement
Respond
Grouped messages
Engagement
Respond
Automation rules
Engagement
Respond
Redact messages
Engagement
Respond
Routing customer replies
Engagement
Respond
Interact with comments
Engagement
Respond
Respond workflow tips
Engagement
Respond
Contact Reporting
Engagement
Contact
Contact Queue Filters
Engagement
Contact
Contact WhatsApp Queues
Engagement
Contact
Schedule overview
Engagement
Schedule
Serve overview
Engagement
Serve
Installing Serve
Engagement
Serve
Contact in Serve
Engagement
Serve
Serve Messaging
Engagement
Serve
Serve user management
Engagement
Serve
Forms in Serve
Engagement
Serve
Configuring Serve
Engagement
Serve
Serve reports
Engagement
Serve
Serve Currency
Engagement
Serve
Serve POS QR Code
Engagement
Serve
Activate CSV export
Engagement
Activate
Track Overview
Insights
Track
Track Metric Tables
Insights
Track
Track Event Tables
Insights
Track
Lexer Product Recommender → Klaviyo Integration
Grow
Lexer Product Recommender → Klaviyo Integration
Where do your best customers live? Use geographic insights to maximize media spend and conversion
Grow
Where do your best customers live? Use geographic insights to maximize media spend and conversion
Suppression audiences: How to use them and maximize your media effectiveness
Enrich
Suppression audiences: How to use them and maximize your media effectiveness
Measure campaign effectiveness: Track your KPIs and report on campaign performance
Enrich
Measure campaign effectiveness: Track your KPIs and report on campaign performance
Converting prospects: Acquire customers from your current, engaged prospect base (and save your ad spend!)
Acquire
Converting prospects: Acquire customers from your current, engaged prospect base (and save your ad spend!)
Understanding customer intent: Effective message personalization for buyers who shop outside their gender
Grow
Understanding customer intent: Effective message personalization for buyers who shop outside their gender
Deepen customer understanding: Use third-party data to identify insights for personalized messaging and increased engagement
Grow
Deepen customer understanding: Use third-party data to identify insights for personalized messaging and increased engagement
Basket analysis: Increasing customer lifetime value through targeted product bundling
Grow
Basket analysis: Increasing customer lifetime value through targeted product bundling
Persona building: Personalize your messaging for maximum return on your campaign investments
Grow
Persona building: Personalize your messaging for maximum return on your campaign investments
Driving customer loyalty: Identify, keep, and grow your most loyal customers
Retain
Driving customer loyalty: Identify, keep, and grow your most loyal customers
Increasing customer lifetime value: Upselling strategies
Grow
Increasing customer lifetime value: Upselling strategies
Reactivating lapsed customers: Retention and growth
Retain
Reactivating lapsed customers: Retention and growth
Welcome offer strategies: Using the Hub for analysis
Acquire
Welcome offer strategies: Using the Hub for analysis
Creating customer forms: Best practices
Enrich
Creating customer forms: Best practices
Connecting your MarTech stack with Lexer!
Enrich
Connecting your MarTech stack with Lexer!
Identifying win-back customers using the Second Last Order: Date attribute
Retain
Identifying win-back customers using the Second Last Order: Date attribute
Understanding customers' purchasing habits: Order Sequence filter
Grow
Understanding customers' purchasing habits: Order Sequence filter
Maximizing customer communications in Respond
Retain
Maximizing customer communications in Respond
Using Product Recommendation in the Hub to encourage repeat purchases
Grow
Using Product Recommendation in the Hub to encourage repeat purchases
Encouraging customer loyalty using birthday campaigns
Retain
Encouraging customer loyalty using birthday campaigns
Increasing customer lifetime value: Converting your one-time buyers into two-time buyers
Grow
Increasing customer lifetime value: Converting your one-time buyers into two-time buyers
Collecting zero-party data using Lexer Forms
Enrich
Collecting zero-party data using Lexer Forms
Measuring your data over time with Track
Enrich
Measuring your data over time with Track
UTM Creation Guidelines
Brand Assets
Brand Assets
Brand Assets
GTM guide to creating marketing materials with Lexer
How to use the Lexer Form Builder
Explore our standard integrations
Operating a CDP Practice LP
LP Sales Enablement
LP Sales Enablement
LP Sales Enablement
Video Training Courses LP
Purpose and Mission
Purpose and Mission
Purpose and Mission
Brand & Marketing LP
Stage 3 - QBRs and Customer insights
Client Onboarding Journey
Start your CDP Practice
Lexer Messaging
Lexer Messaging
Lexer Messaging
Pain point conversations
Lexer Ideal Customer Profile & Positioning
Referral Partner Program Overview
Demo Hub Guide
Demo Hub Guide
Demo Hub Guide