Track Dashboards
You told us reporting shouldn’t be a chore. You asked for faster, simpler ways to turn your data into reports you'd actually use, fewer clicks, more visualization, and less reliance on external tools.
So we revamped Track around retail-ready tables and charts that plug straight into your segments, events, and metrics. Track is now more intuitive, faster to build, nicer to look at, and easier to get value from your data.
Track Dashboards let you to group related customer segments, metrics, and events together to tell a story.
Track Dashboards make it easy to display multiple metrics, charts, and tables all in one place. Organize as you like. Compare changes over time. And help make better business decisions.
Start tracking the growth of your high-value segments, the AOV of online shoppers vs retail, key KPIs by store, RFM segments, or any event-based behaviors.
In this article:
- Upgrade a dashboard
- Create New Dashboard
- Adding Metic cards
- Adding Tables
- Dashboard Date Range
- Adding Text Boxes
- Rearranging Cards
- Resizing Cards
- Card Settings
- Set Card Date Range
- Change Chart Type
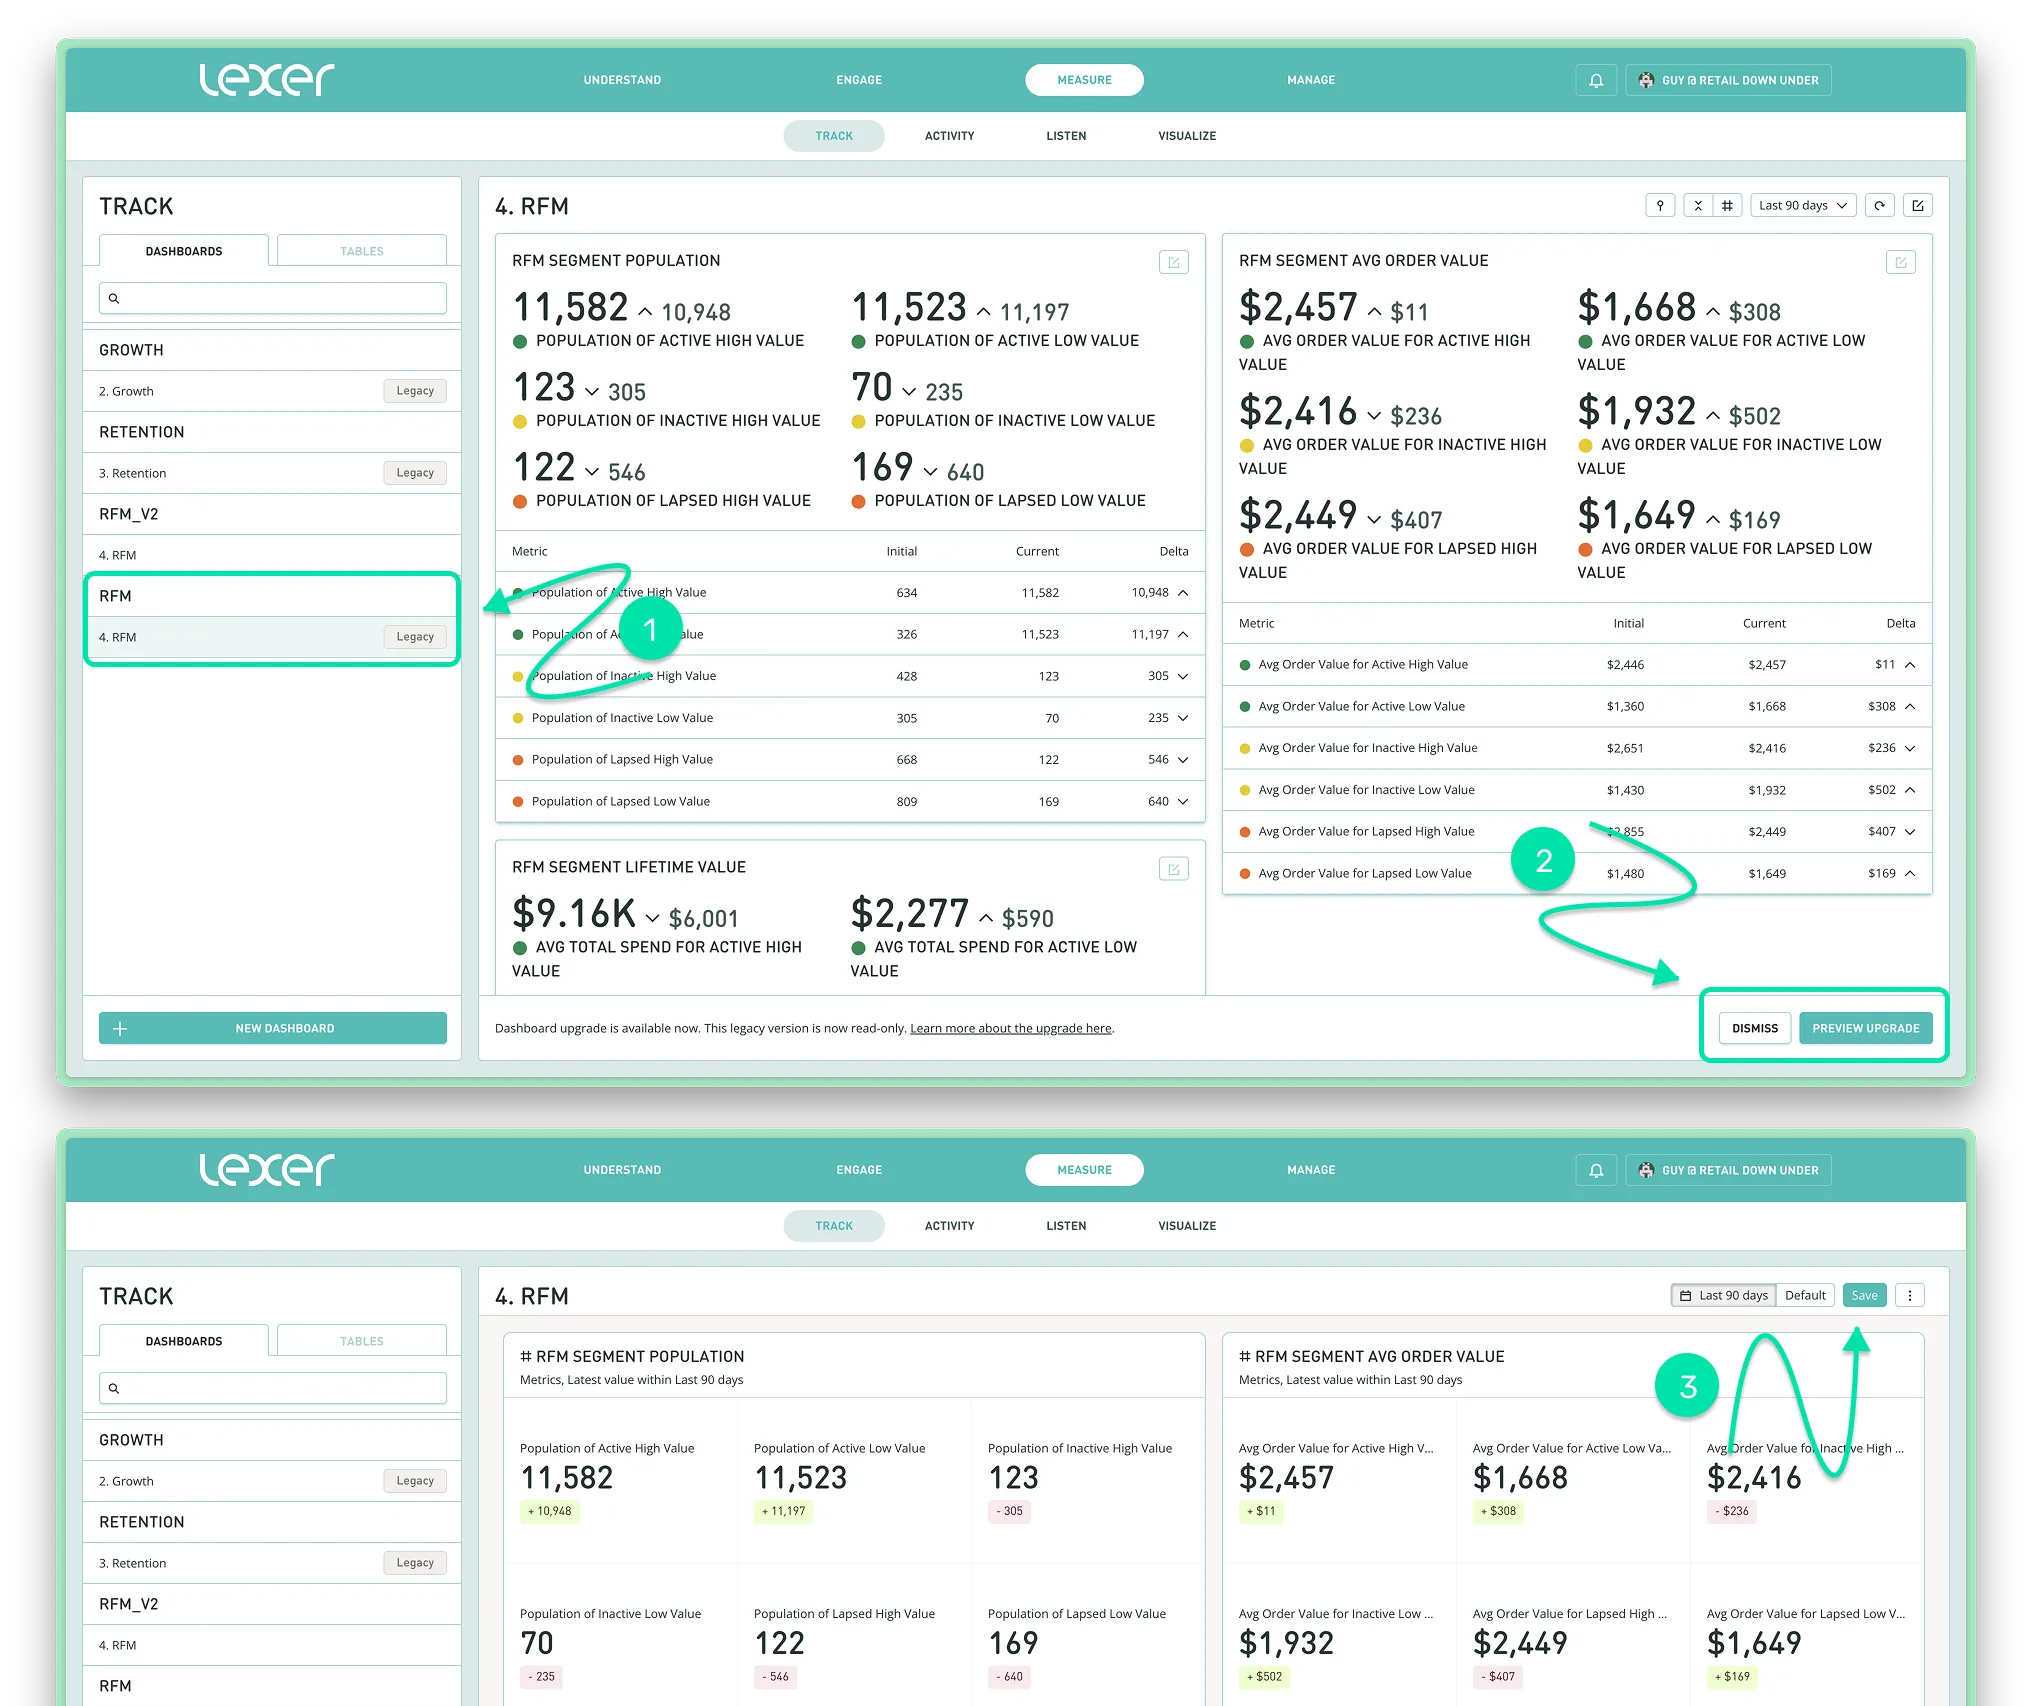
Upgrade a Dashboard
- Existing dashboards appear with a Legacy label. These are now View Only
- To see the new and improved version, select Preview Upgrade
- Hit Save to complete the upgrade
Once saved, you can now edit, and will have access to the new features
If you no longer need a legacy dashboard, this is a good time to clean up your list
NB: Support for Legacy dashboards will be turned off March 2026, make sure to upgrade before then!
Create New Dashboard
- Navigate to Measure > Track and click New Dashboard
- To add a Name, Category, Description, show deltas, delta format, and select which groups should have access. Navigate to the top right corner and locate the 3 dots
- Select Edit Dashboard
- Select Save.
.webp)
Adding Metric Cards
- Select Add Content, or Add Card to Row
- Select the Metrics – This will open the Create Metric Card tab
- Locate the Segment you want to track and how it should be tracked (Segment Population or an Attribute Value)
- Name the Metric Card
- Select Next to open the Preview tab
- Add the Card Title, Card Description, and Display Type
- A preview of the Card will generate. Approve and Add
NB: Track will start to measure from the time you first create the metric.
Adding Tables
There are two options for adding Tables to your Dashboard.
- Add an existing saved Table
- Create a new Table from within Track.
To add an existing saved table from Event Explorer
- First, In Event Explorer, configure your event analysis and save the Table
- Open a new or existing Track Dashboard
- Select Add Content/Row
- Choose Tables
- Select the saved Table
- Add it to the Dashboard.
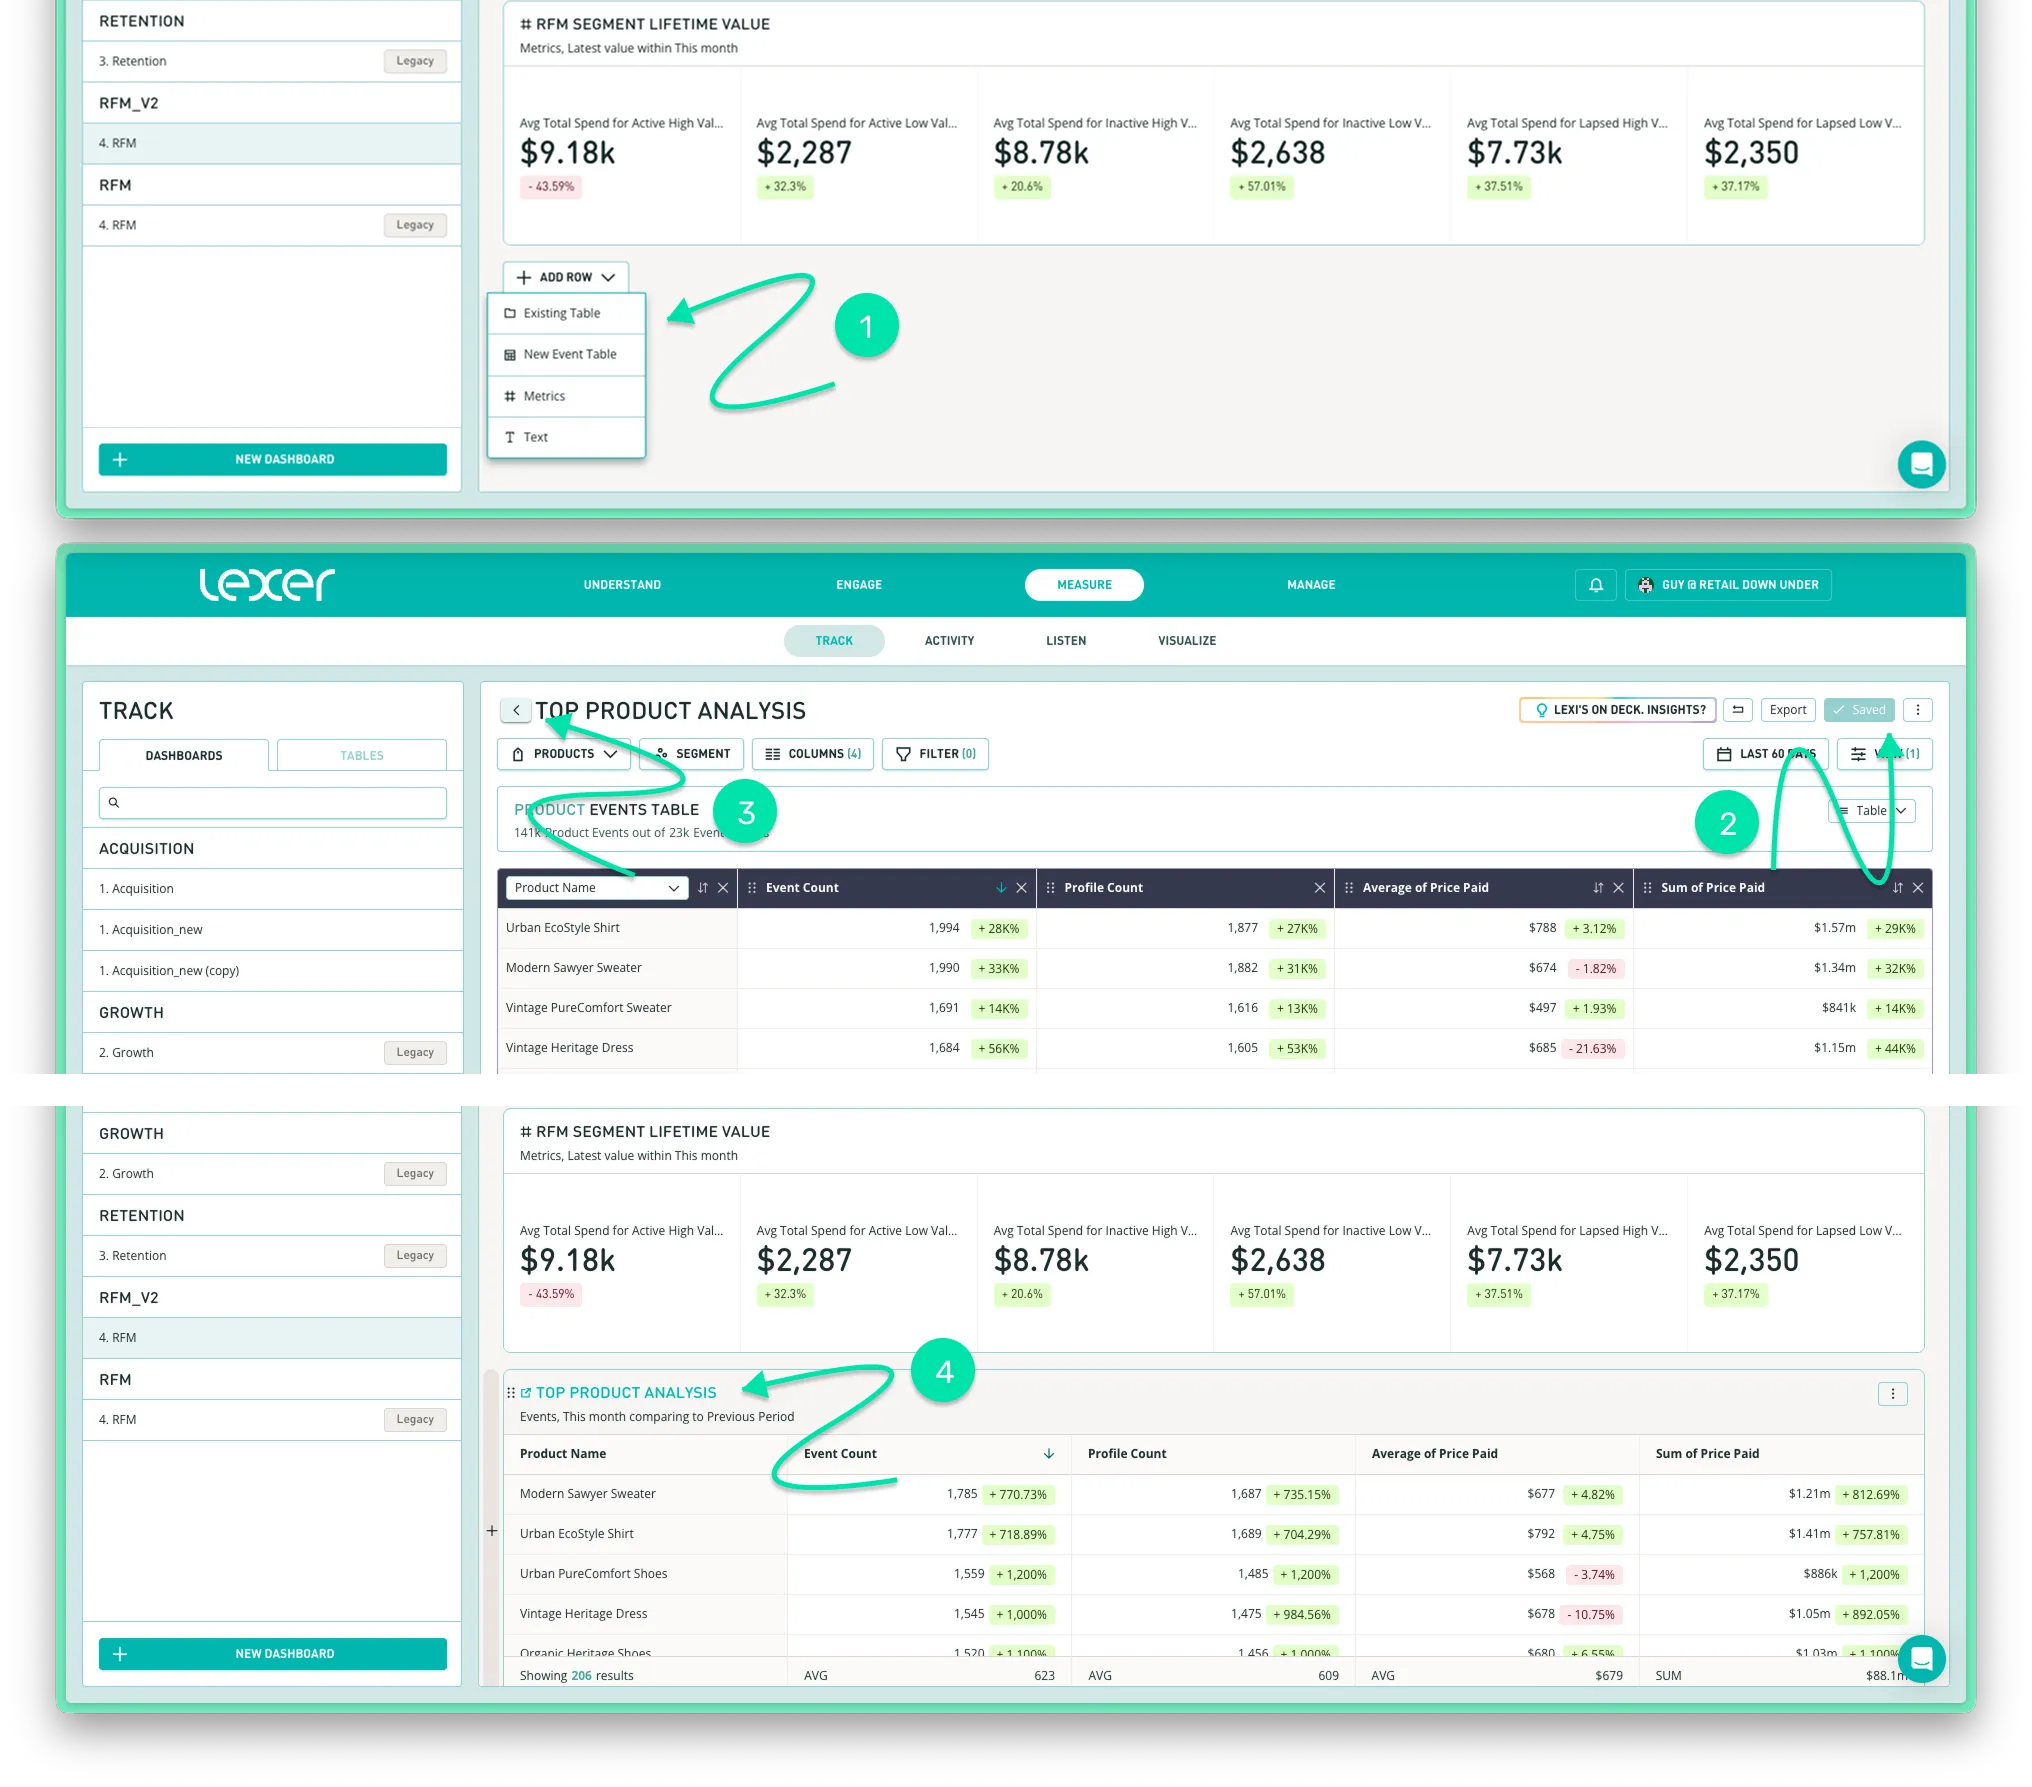
To create and add a new Table from within a Track Dashboard
- Select Add Content/Row, then New Event Table
- Run your analysis, name and Save the table
- Once saved, navigate to the Dashboard using the back button
- Your new table will now appear
Dashboard Date Range
- In the top-right corner, select the Date Range menu
- Choose one of the following:
- Standard Date Range (Across the Dashboard): Apply a single date range to all cards (overrides individual card settings)
- Default: Use the date ranges defined at the segment, event, or individual card level. This allows you to have different date ranges on the same Dashboard.

Add Text Cards
- Select Add Content / Add Row.
- Choose Text.
- Add content to text card, using the format options:
- Header
- Bold
- Italic
- Underline
- Quote
- Code
- Bullet Points
- Save changes.
Rearranging Cards
- Hover over the top left title area of any card
- When the hand icon appears, click and hold
- Drag the card to the desired position
- Release the mouse to place the card
- Save changes.
Resizing Cards
- Select a card.
- To expand horizontally: hover between the card and its neighbor (left or right) until a small pill handle appears
- To expand vertically: hover between the card and its neighbor (above or below) until the pill handle appears
- Click and hold the pill, then drag to resize
- Release the mouse when the card is the size you want
- Save changes

Card Settings
At the card level, you can update and adjust settings independently of the dashboard.
- Select a card
- In the top-right corner click the three-dot menu
- From the dropdown, select Card Settings.
From this menu, you can edit:
- Card Title – Rename the card
- Card Description – Add or edit the purpose or context of the card
- Display Value – Choose how the data is visualized
- Date Range – Set the default time period for the data
- Delta View – Show the variance between the default and comparison periods
- Delta Format – Select how the delta is displayed (e.g., number, percentage)
- Comparison Periods – Define the comparison timeframe for delta calculations
- Card Lock – Prevent dashboard-level settings from overriding this card.
.webp)
Set Card Date Range
Specific cards within your dashboard can display different date ranges, eg; a sale or campaign period.
To do this;
- Select the top right menu within a card
- Select Card Settings
- Within the settings you can then specify a Date Range.
Change Chart Type
Event Table Cards can be visualised in several different ways to help best present the data. Choose from Table, Metric, Time Series, or Bar Chart.
- Select the top right menu within a card
- Select Chart Type
- Choose the desired type from the list:
- Table
- Metric
- Time Series
- Bar Chart - Hit Save.