Increasing customer lifetime value: Converting your one-time buyers into two-time buyers
Optimize your growth strategies with Lexer
Having well-planned and executed growth strategies is key to increasing your customer lifetime value. This is because two-time buyers are nine-times more likely to make repeat purchases, compared to 1-time buyers.
In this article, we’ll walk through some hands-on use cases in the Lexer Hub that’ll optimize your growth strategies, including leveraging Smart Search, Compare, and Track.
Using Smart Search “Order Sequence” attributes
Let’s start with a question! Did you know that the first 30 days following a first-time purchase is the most likely time frame for making a second purchase?
And, now that you know this, how do you capture these customers so you can make the most out of this time period?
Using Smart Search attributes and the Order Sequence filter is one way to set this up.
Navigate to the Segment Builder, and then in the attribute picker find your Smart Search attributes.
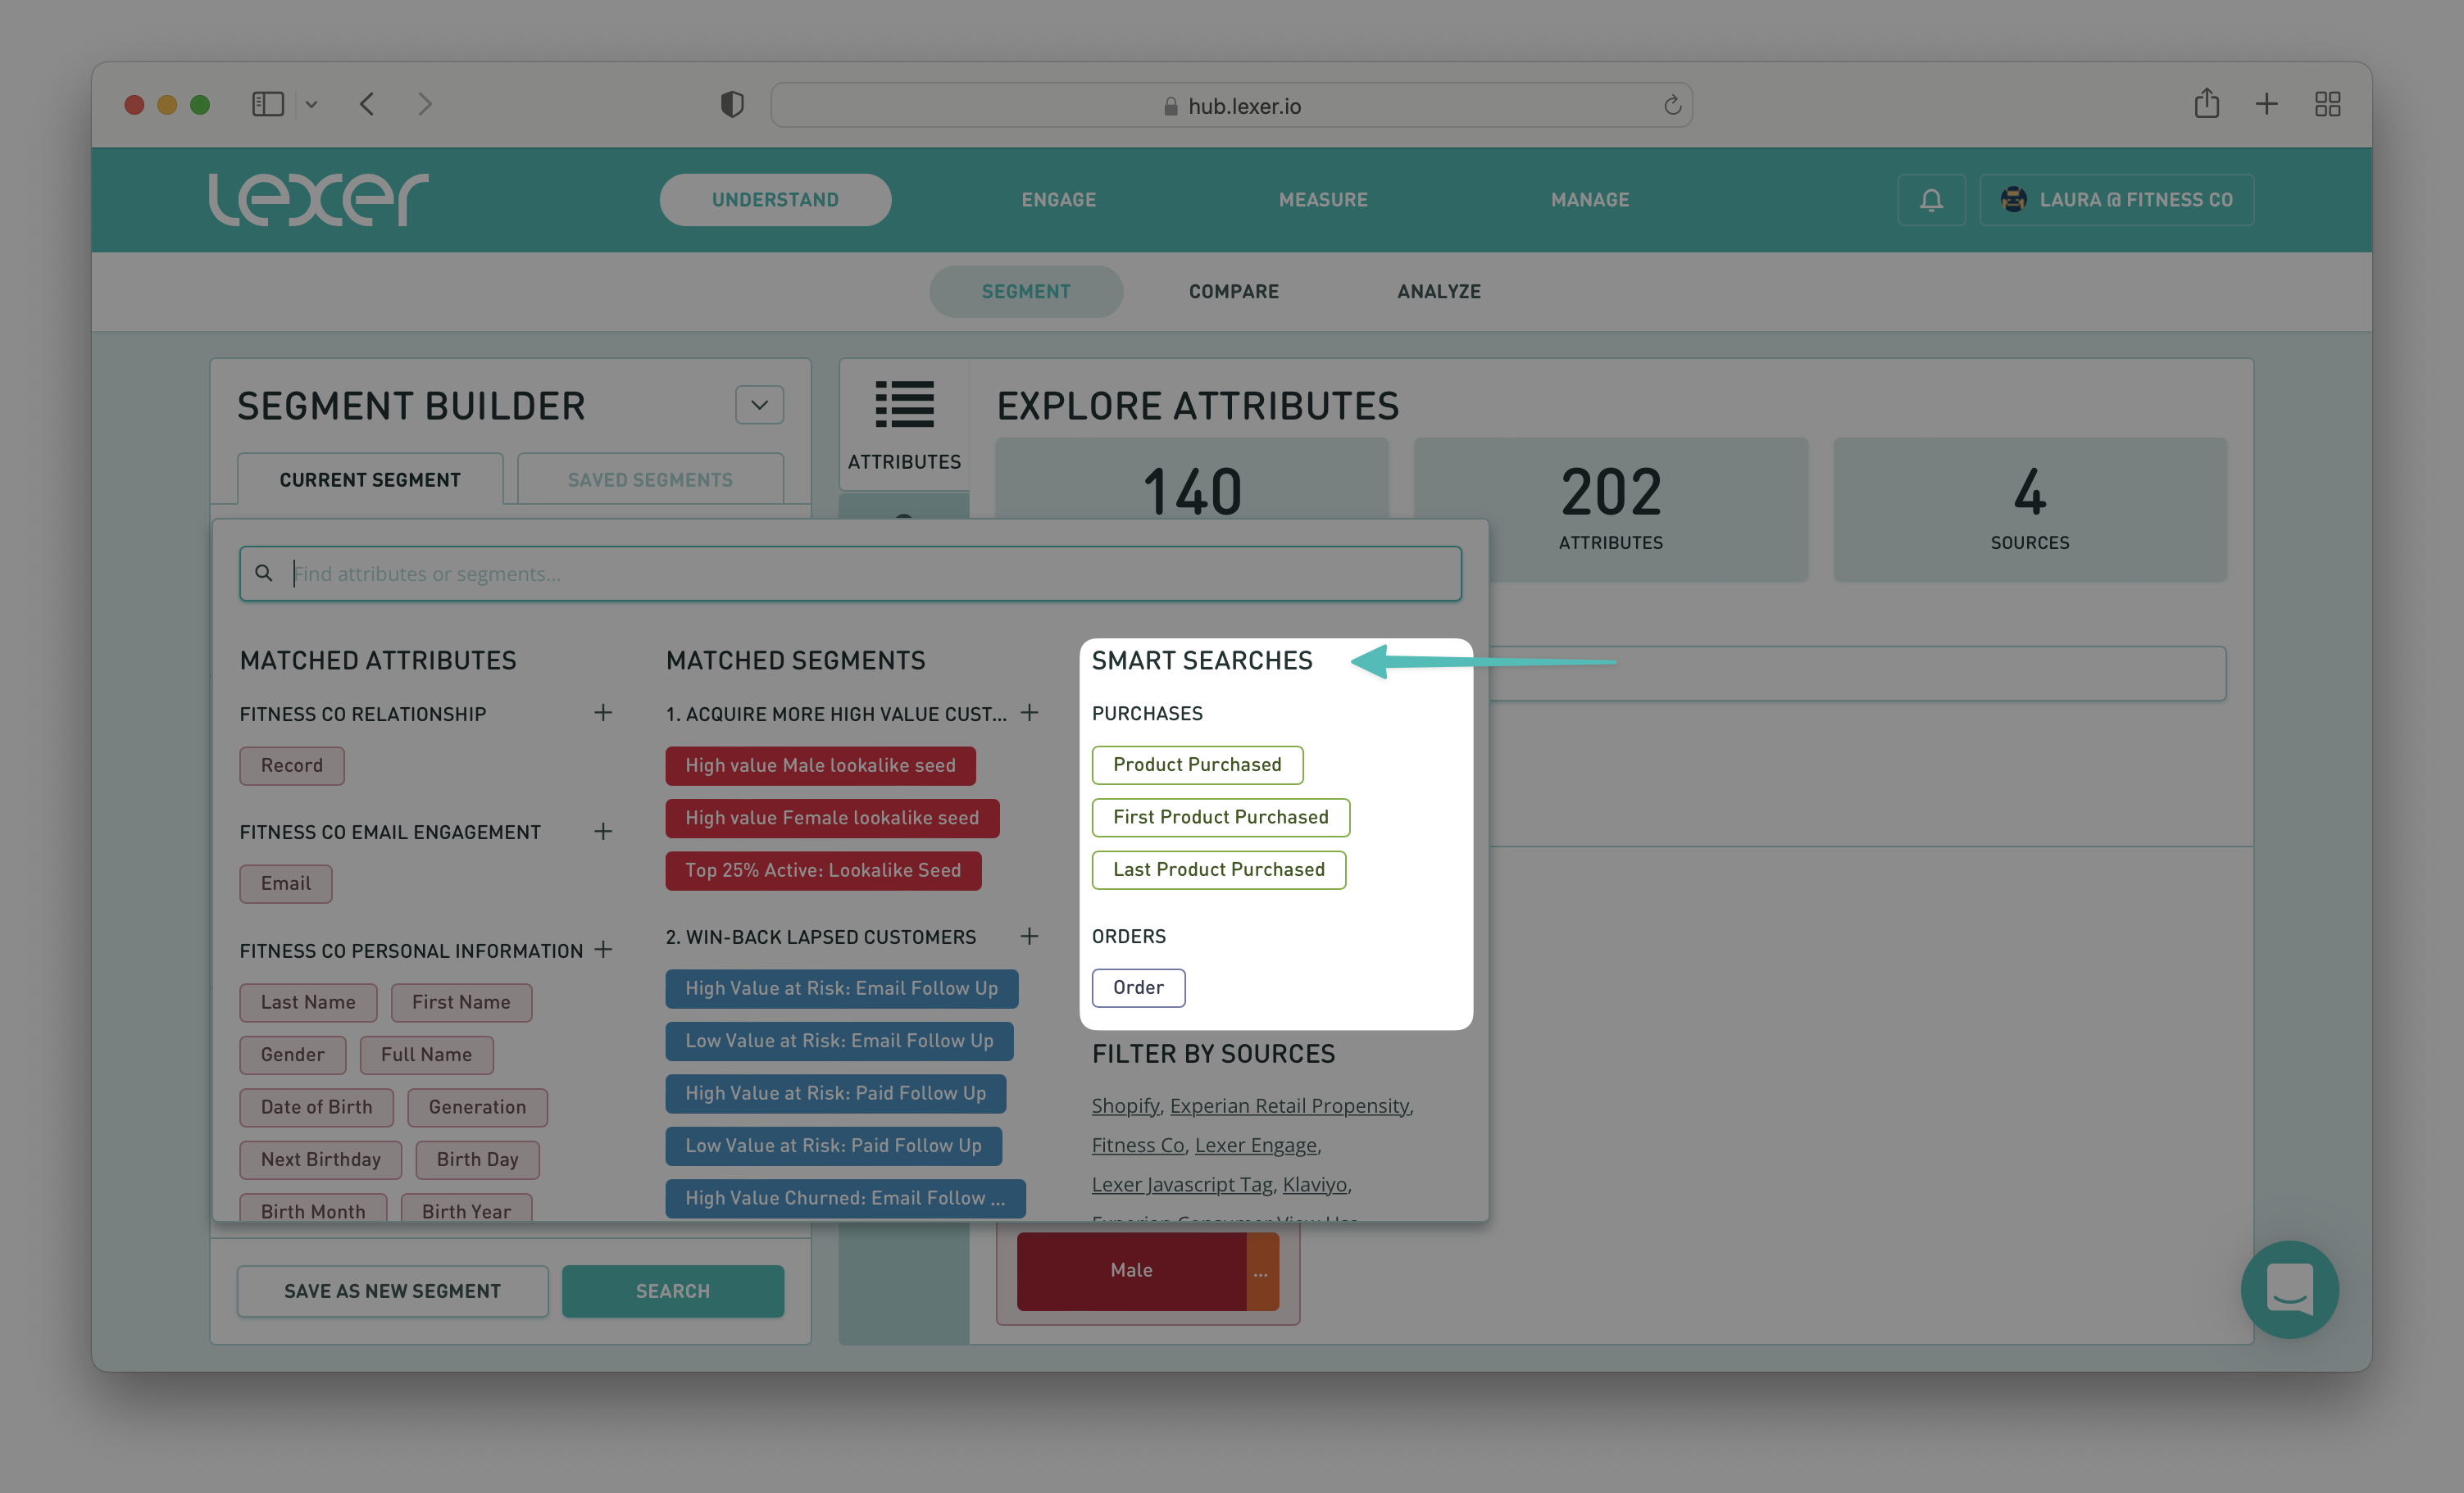
Select the Product Purchased attribute to add to the PROFILES MUST HAVE ALL OF THESE section of the Builder. Then add the following filters:
- Order Sequence > In a specific order > First
- Order date > In the last > 30 days
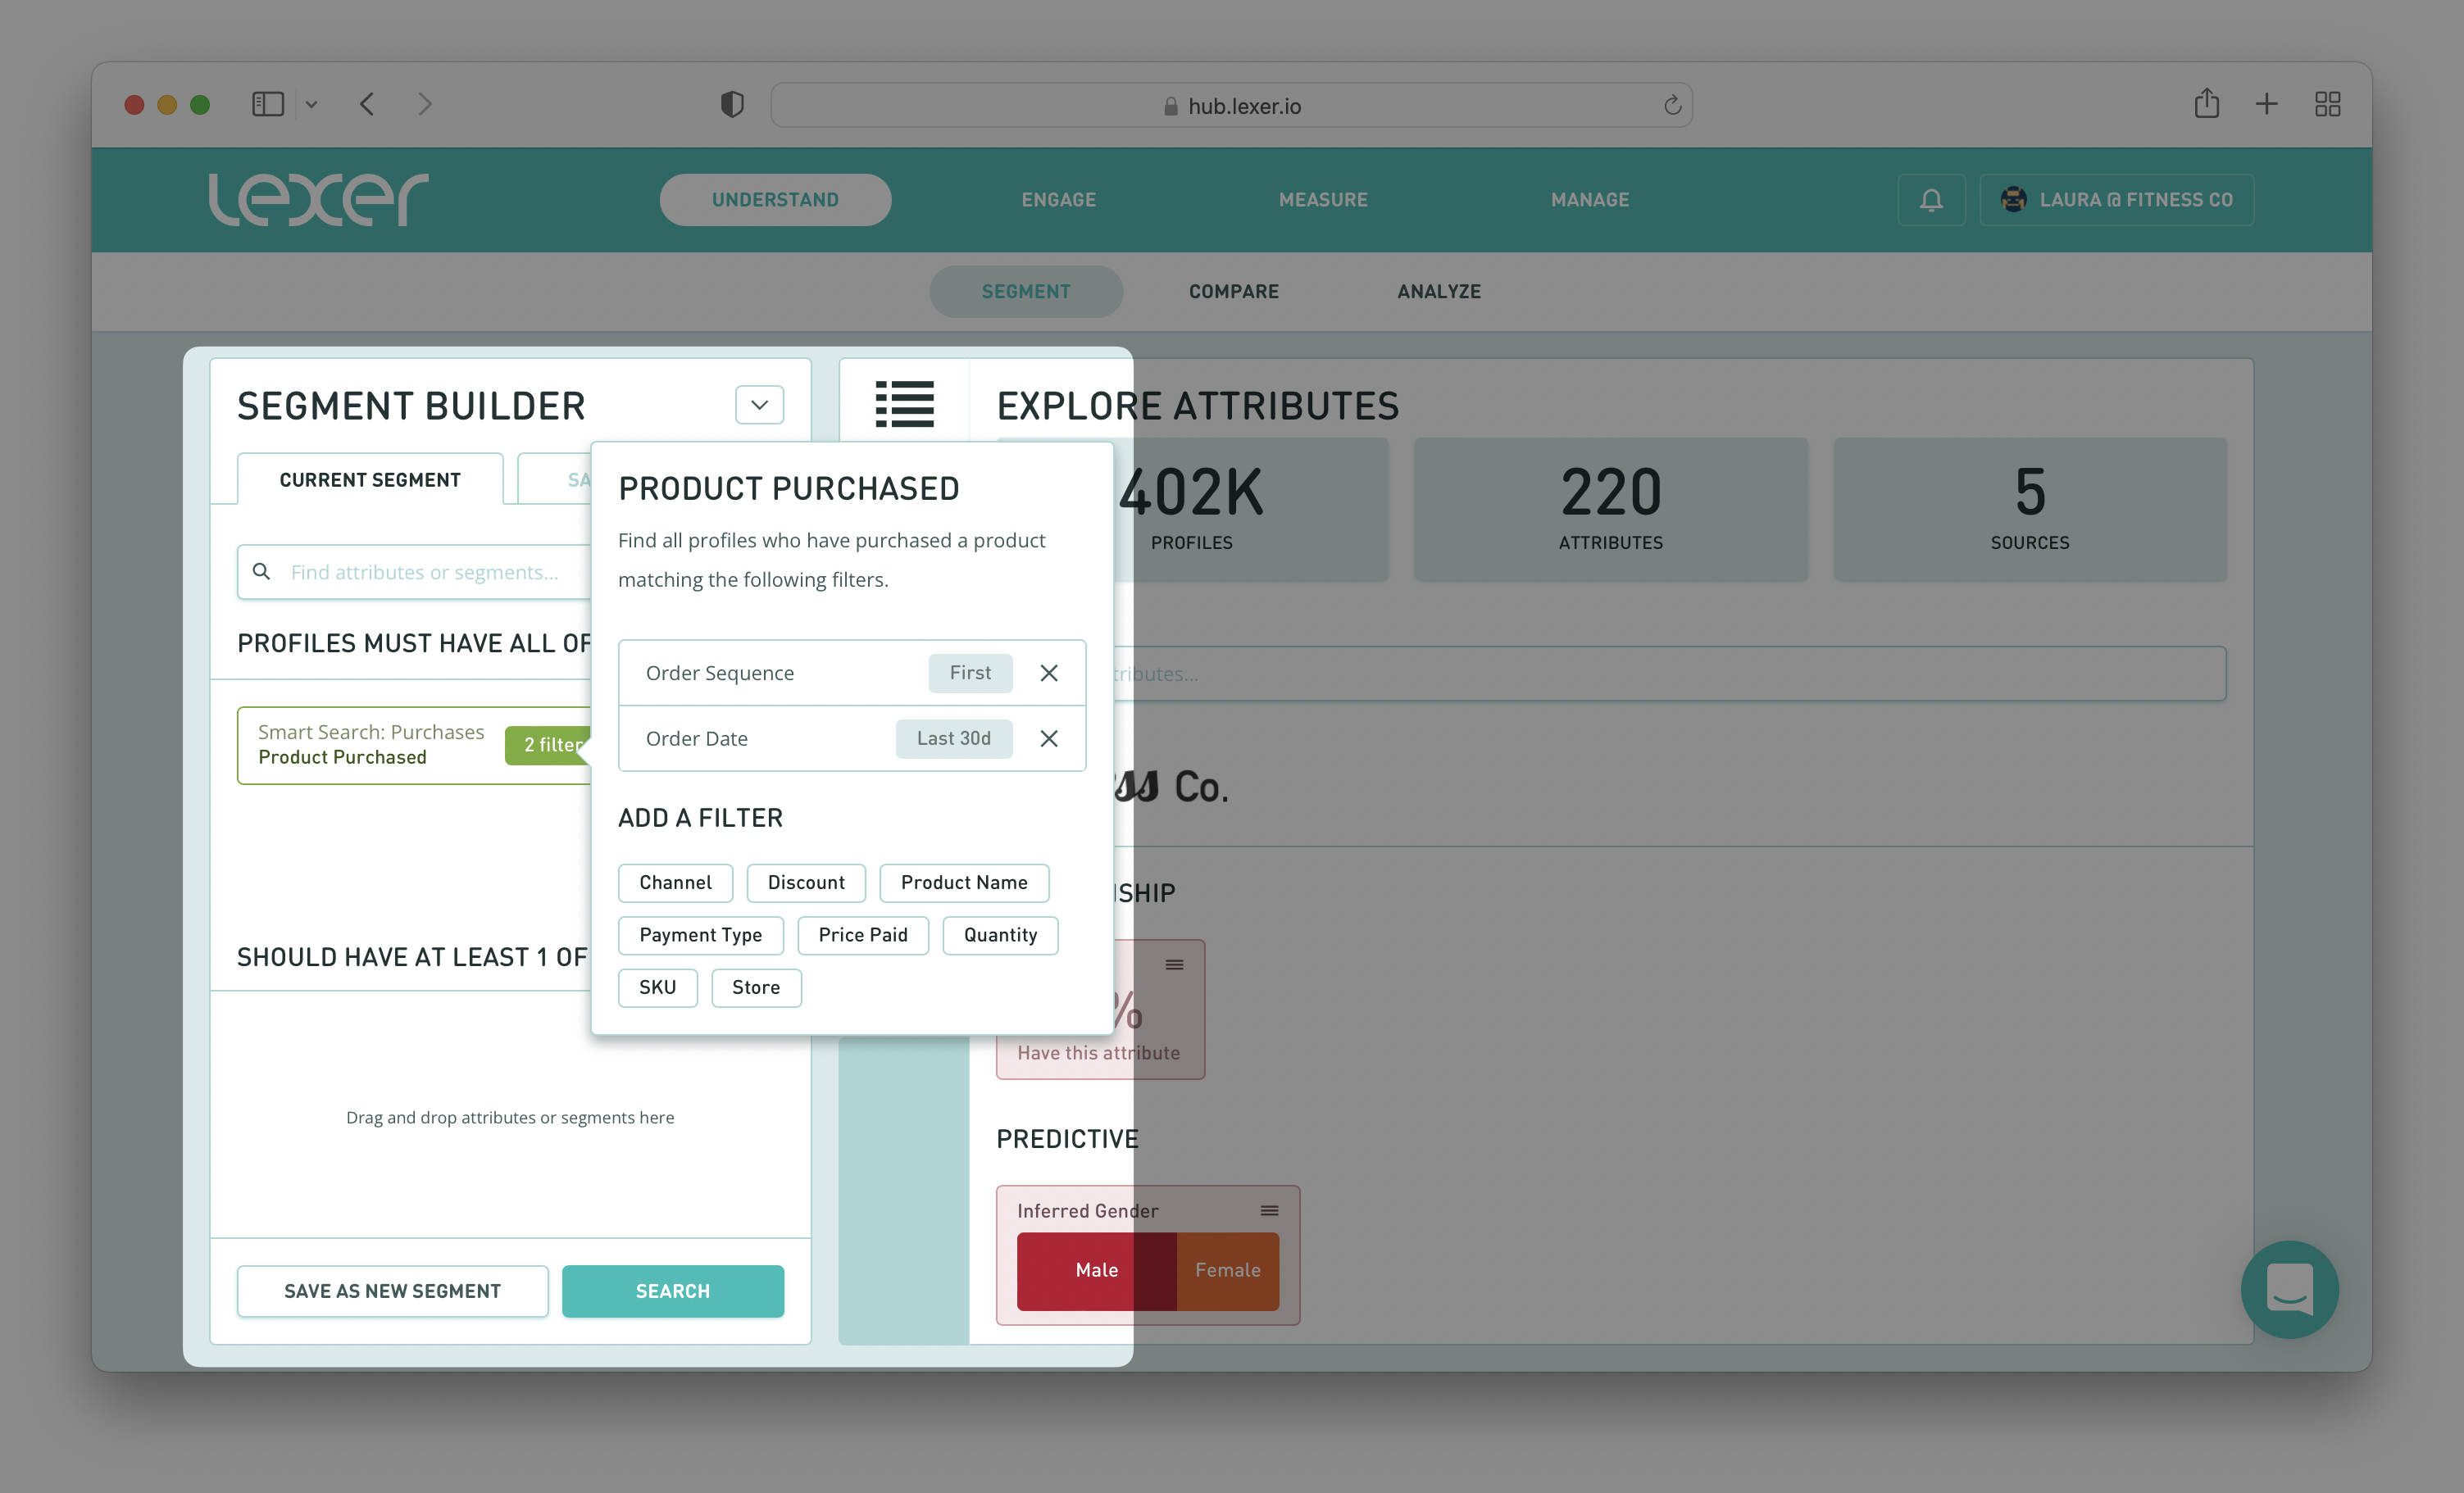
Next, select the Product Purchased attribute again, but this time drag and drop it into the BUT NOT HAVE ANY OF THESE section of the Builder. Then add the following filters:
- Order Sequence > In a specific order > Second
- Order date > In the last > 30 days
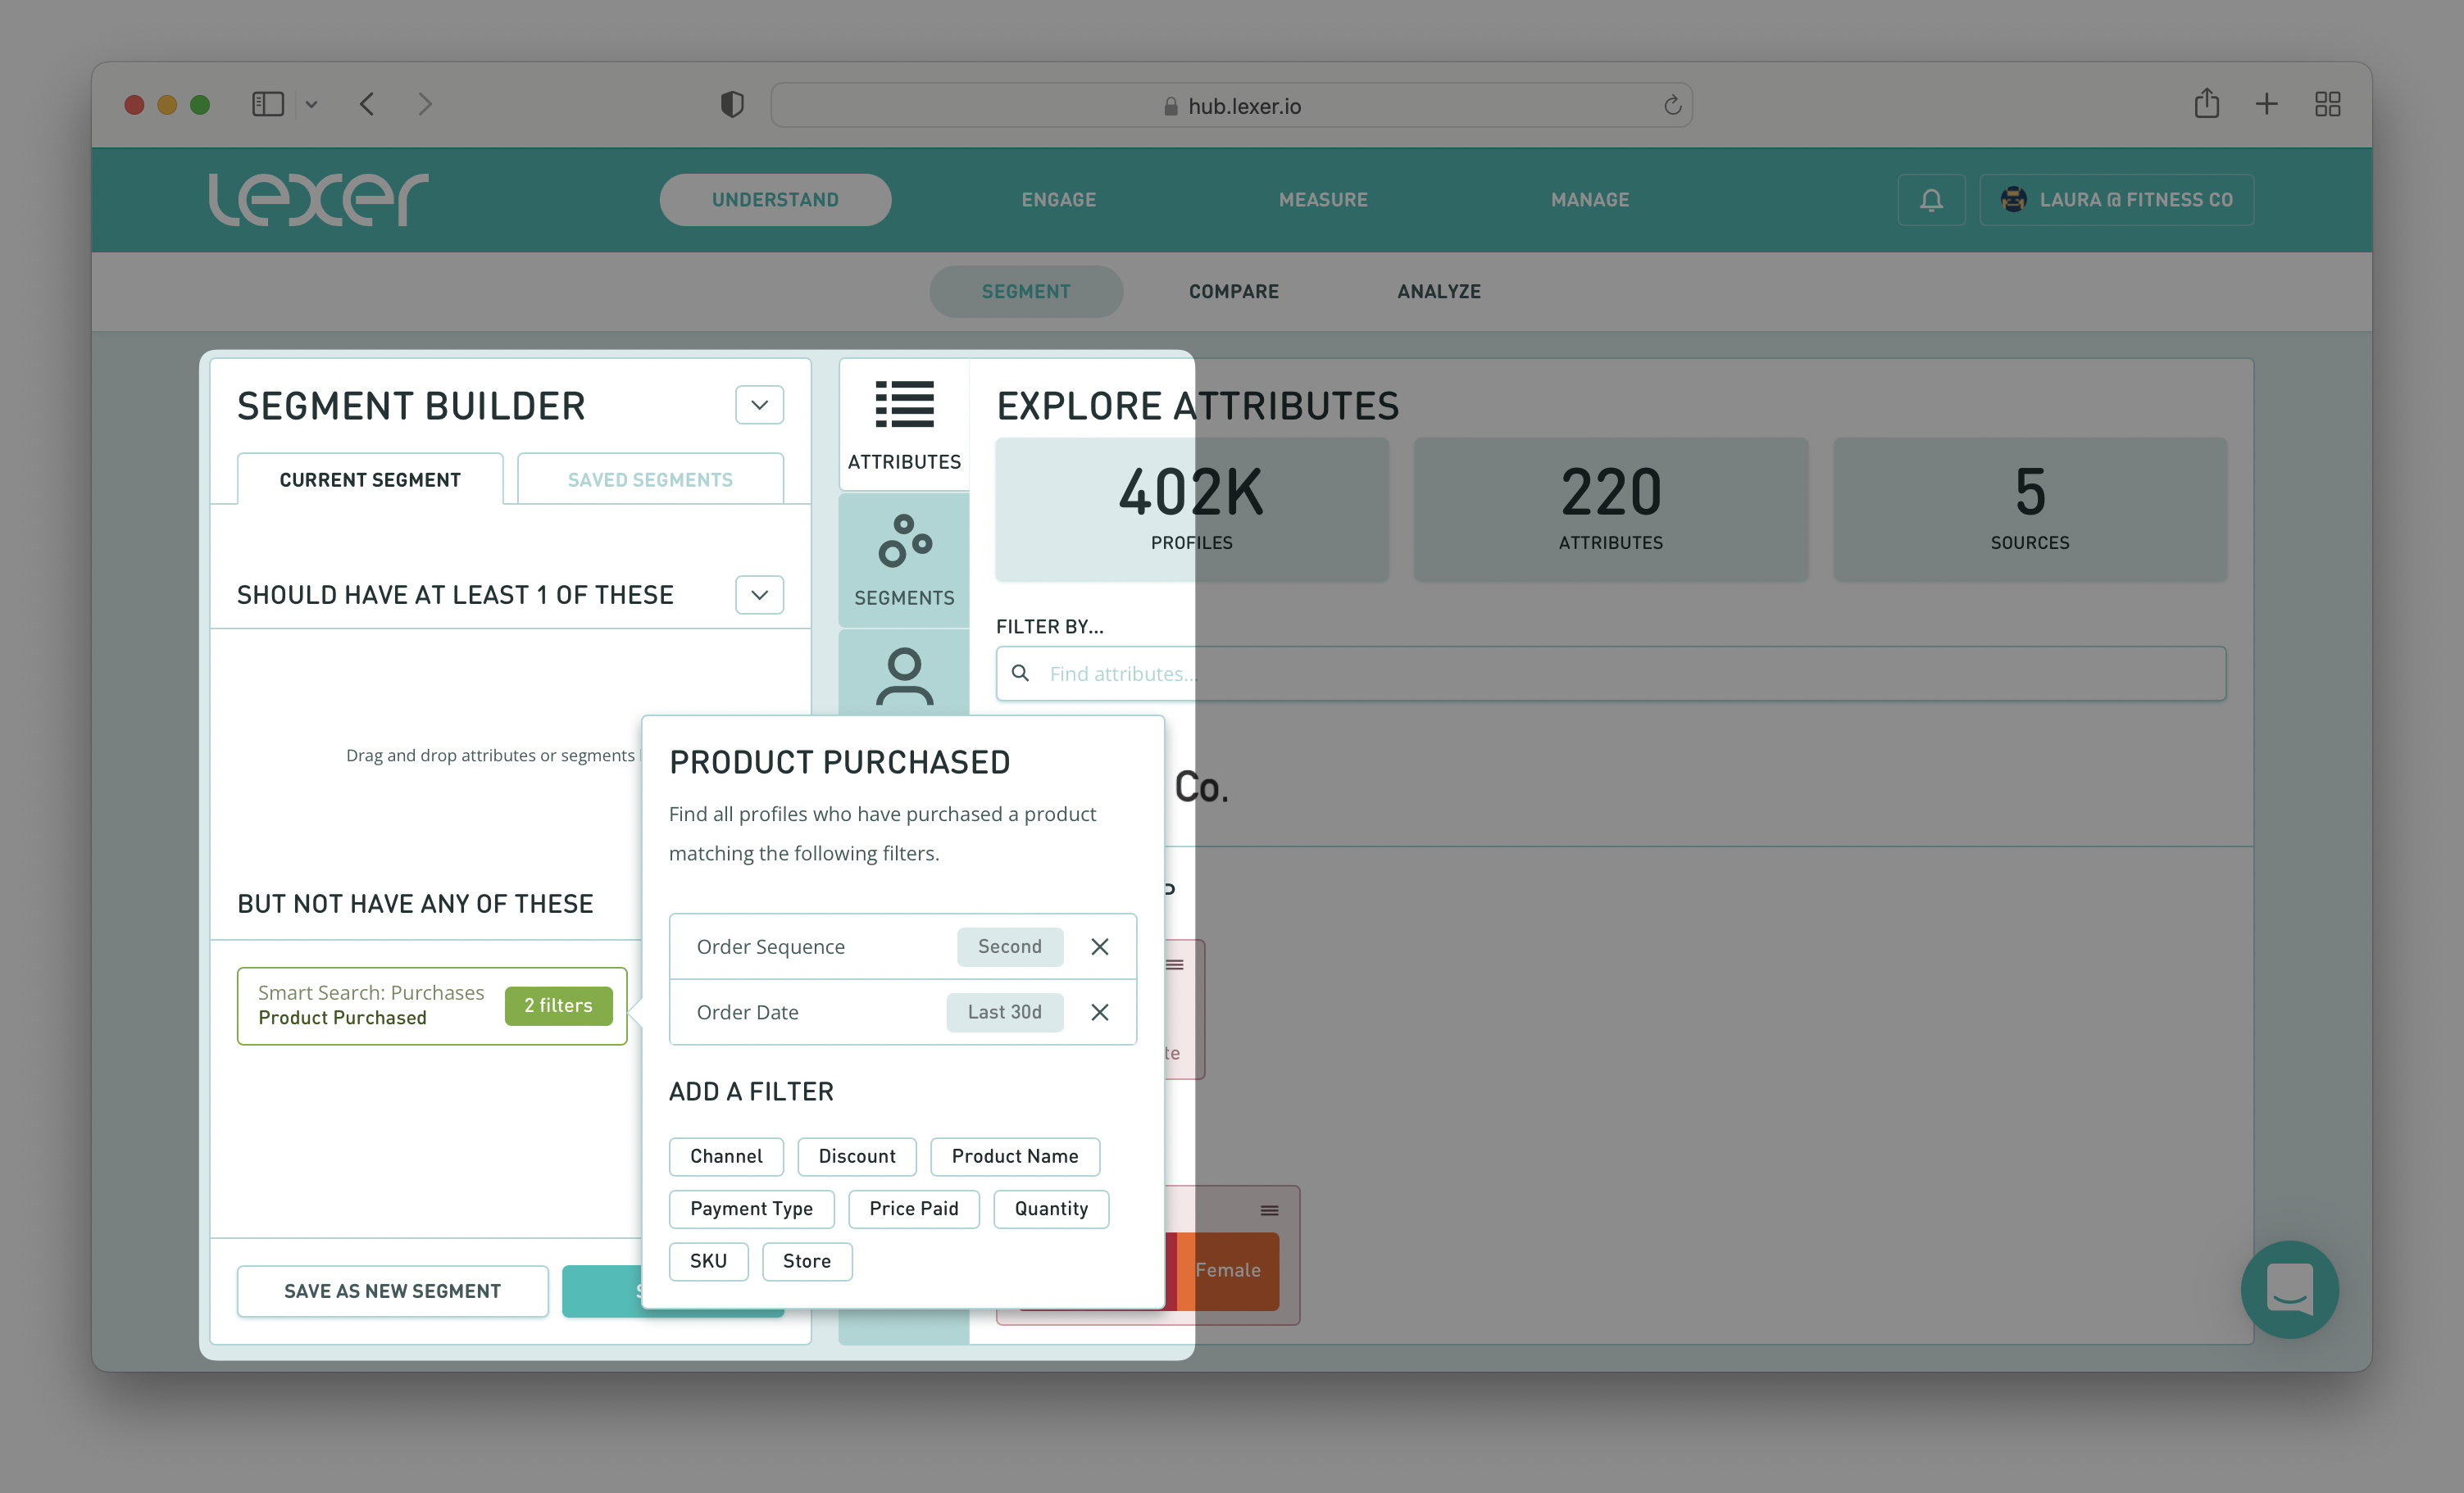
What this query is searching for is customers who have made their first purchase in the last 30 days, but haven’t made a second purchase within the same 30-day period.
Hit Search, and now you have the segment you’d like to target for any 1-time buyer conversion campaigns you want to run.
We have more information here.
A note on conversion time periods
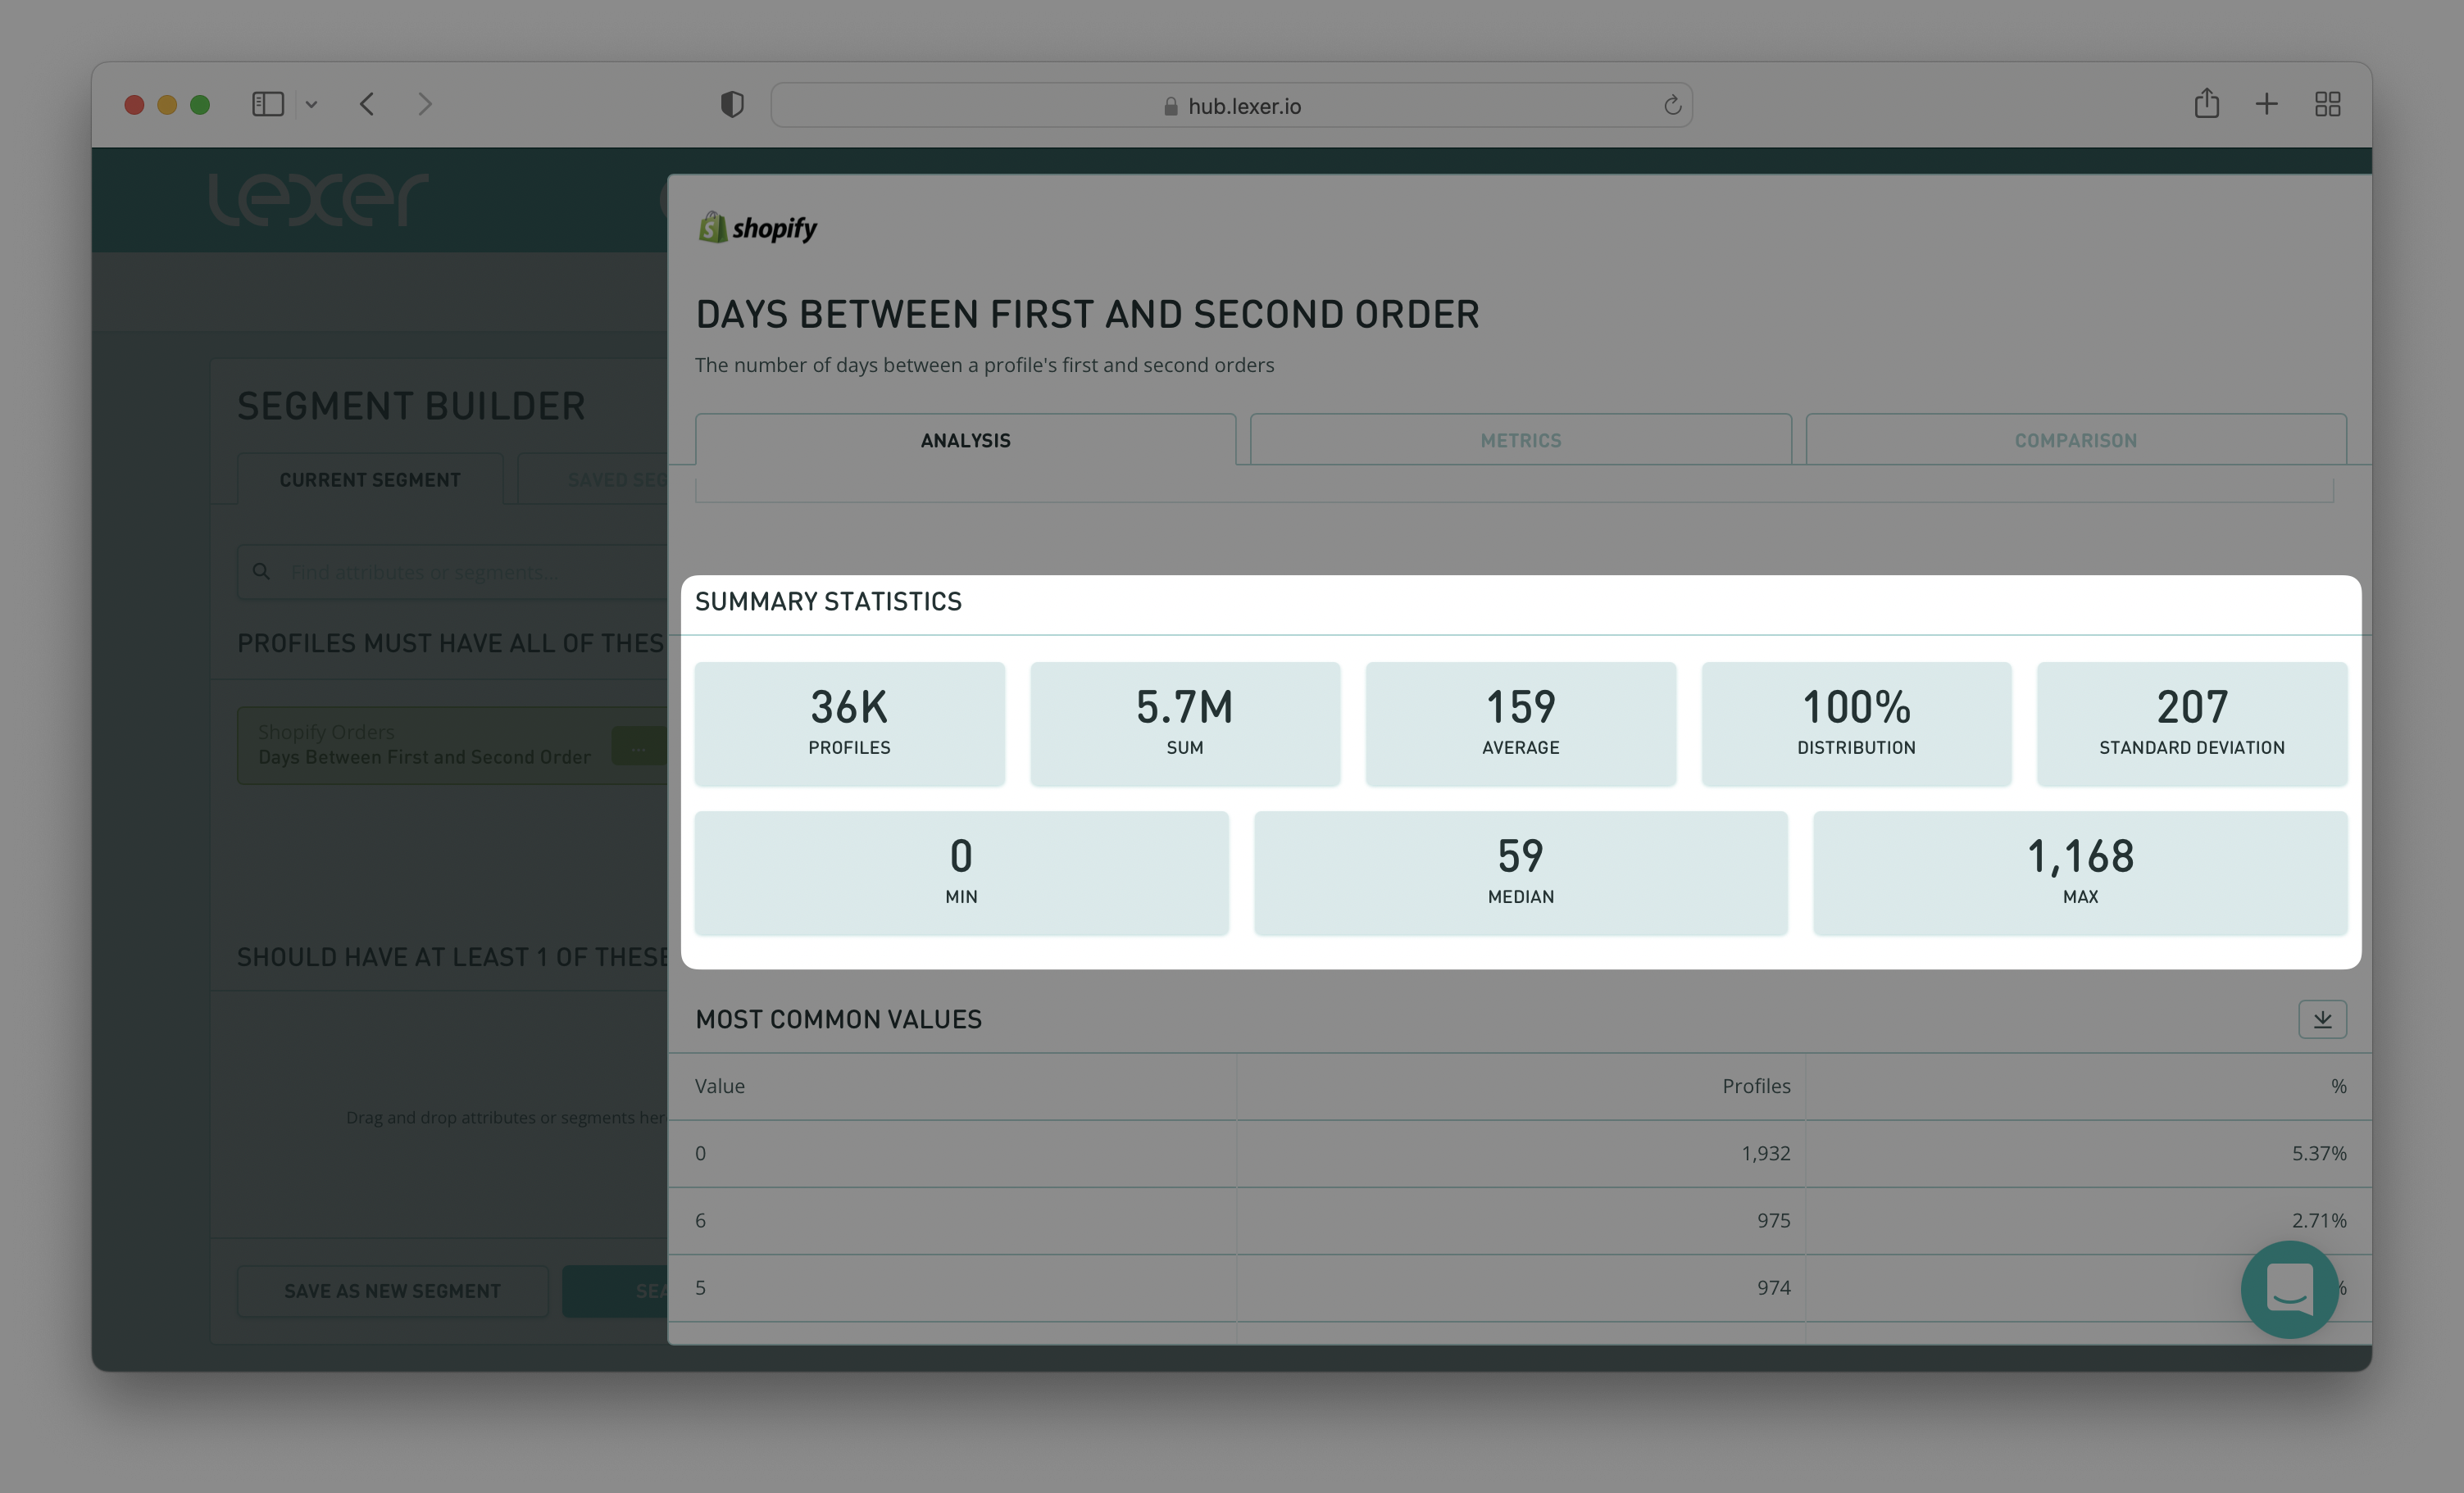
While in the example above we have used 30 days as the conversion window, you also have the option to tailor this to your business. To do so, add the Days Between First and Second Order attribute in the Segment Builder and hit Search.
To the right of the Segment Builder, under Explore Attributes, search again for the Days Between First and Second Order attribute.
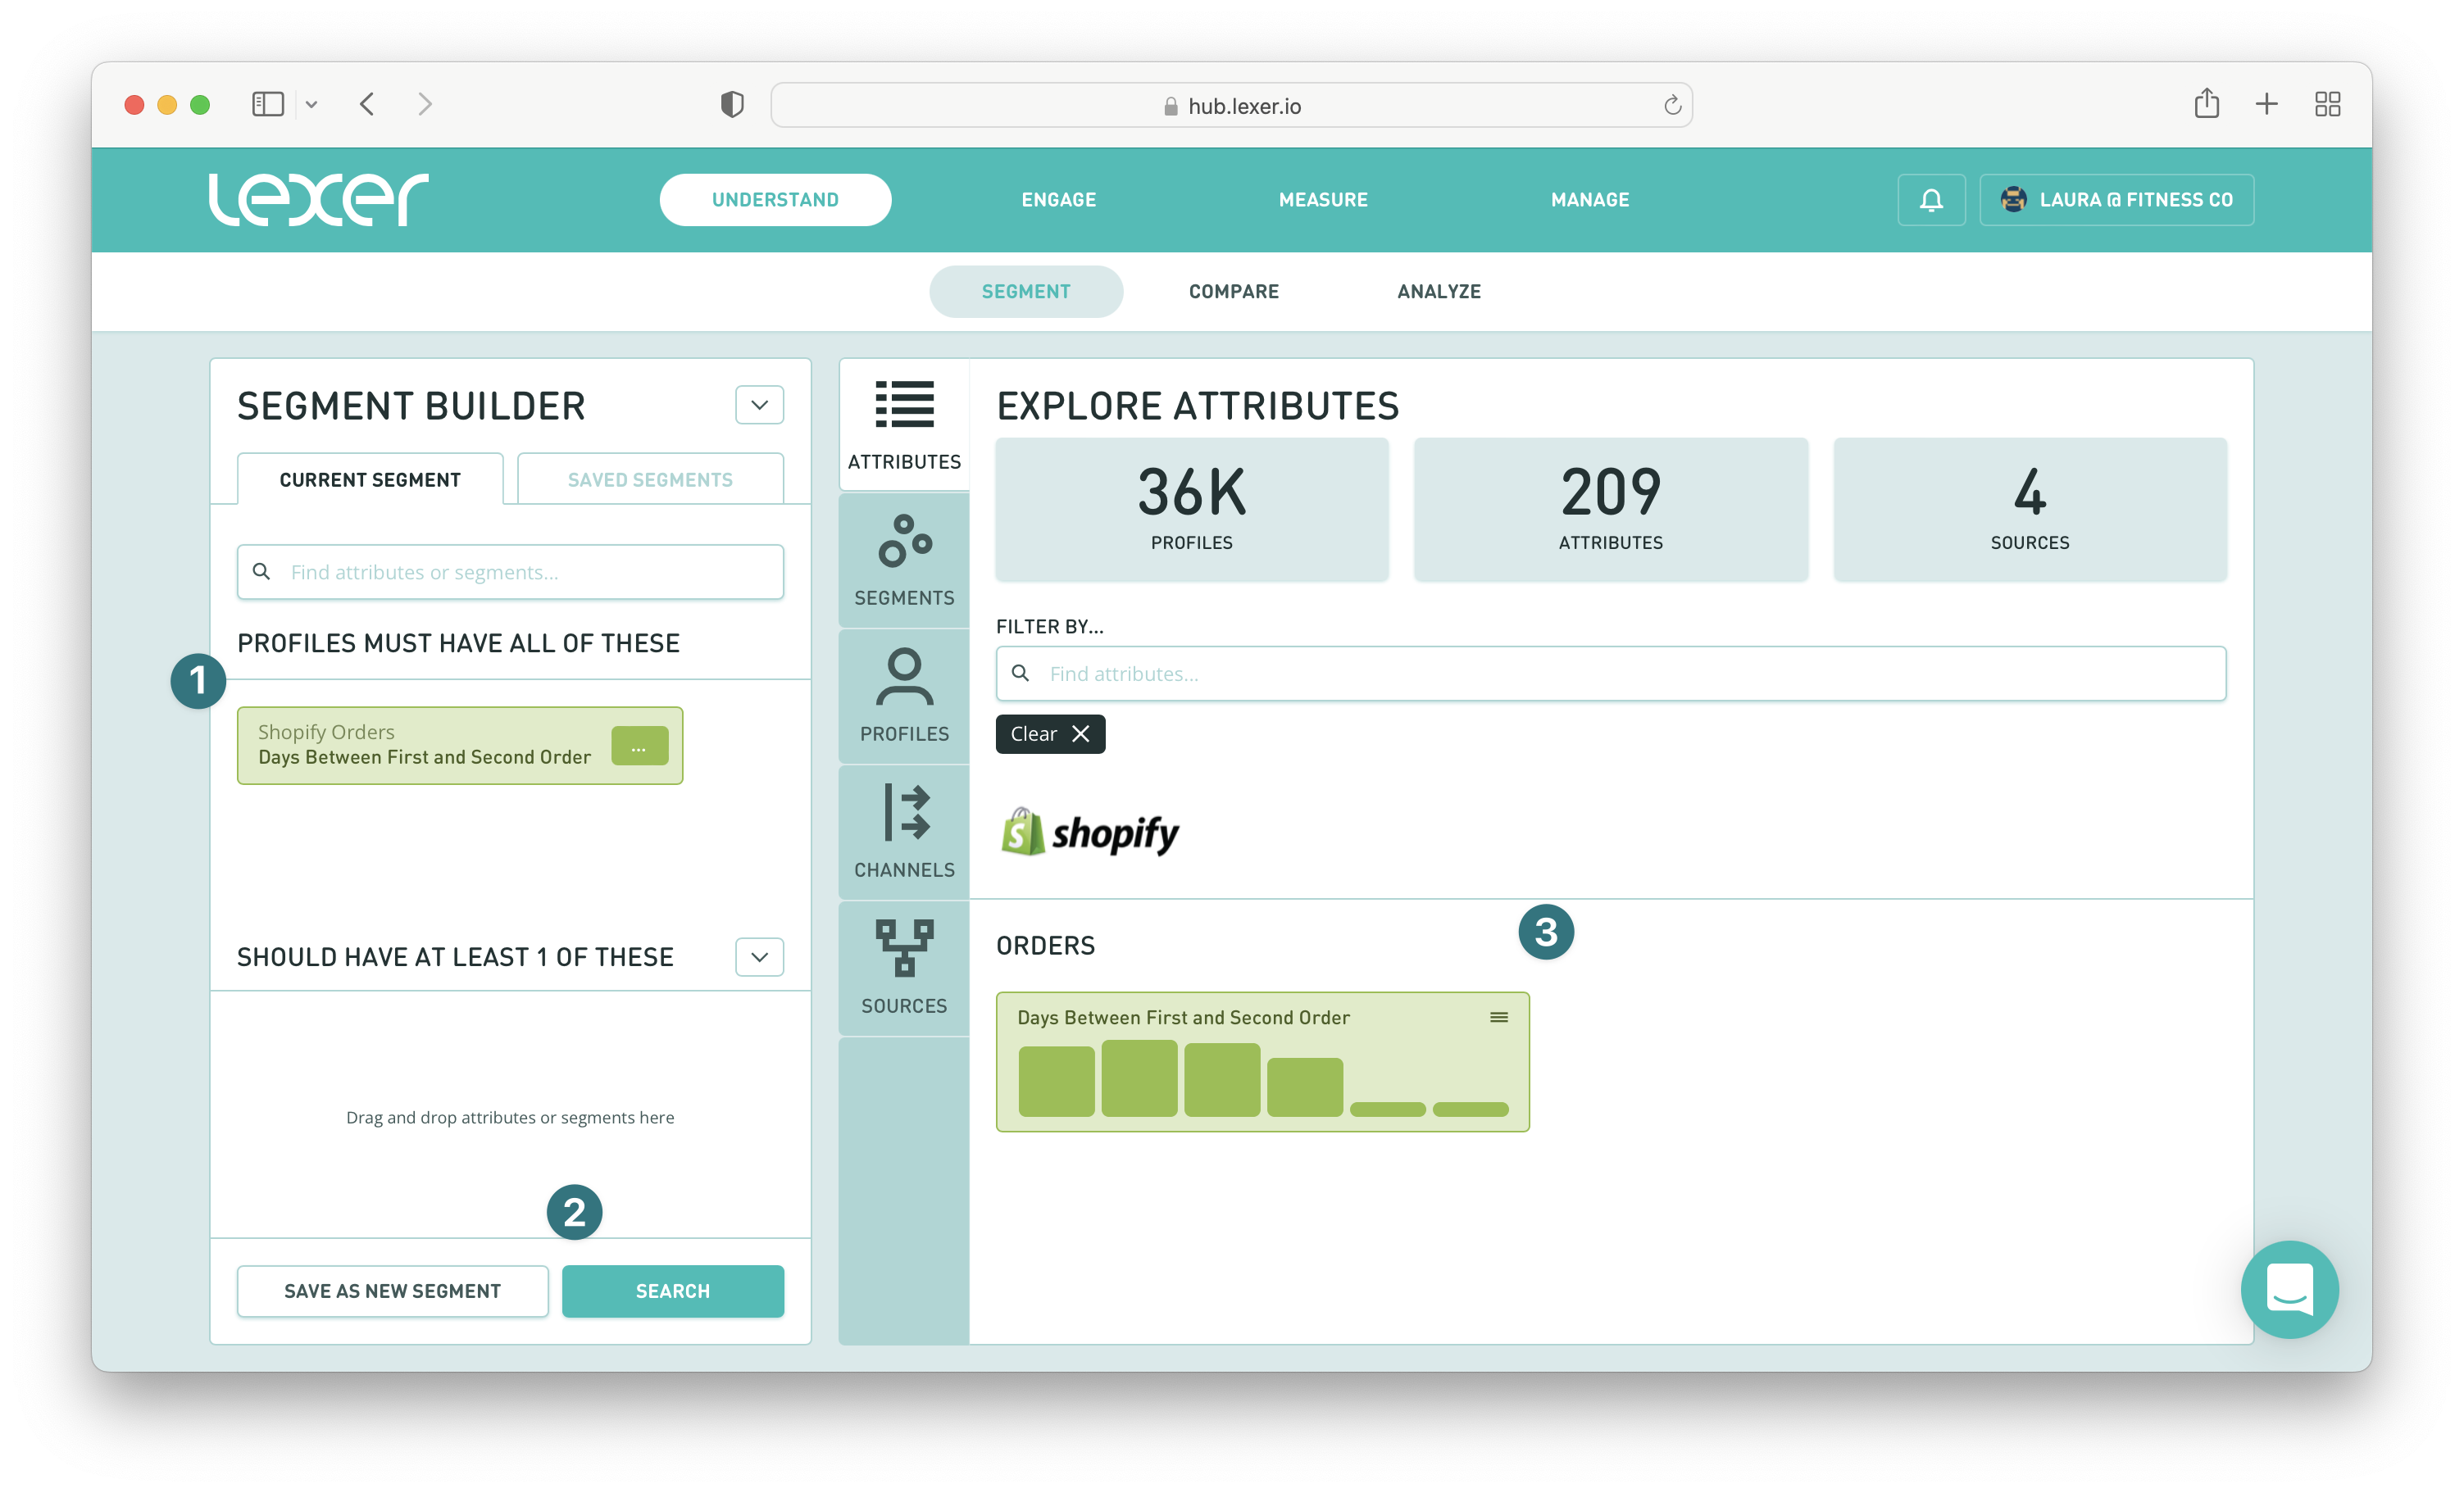
If you click into this attribute and scroll down to Summary Statistics you’ll find your average days between first and second order. You can then include this number in your Smart Search filter for Order Date.
Analyzing the buying patterns of 2-time buyers
Now that you have the customer segment you want to target, how do you create a campaign that will have maximum impact on your 1-time buyers?
Using the Compare tool is a great way to see what makes your 2-time buyers different from the rest of your customer base, and you can then use this information in your messaging.
Let’s take a look!
Navigate to Understand > Compare > Segments. Then search for for the following two segments:
- All customers
- Two Order Customers
Lastly, click Generate Comparison.
Your results will generate on the right side of the page, and you can then explore what makes your 2-times buyers different and unique.
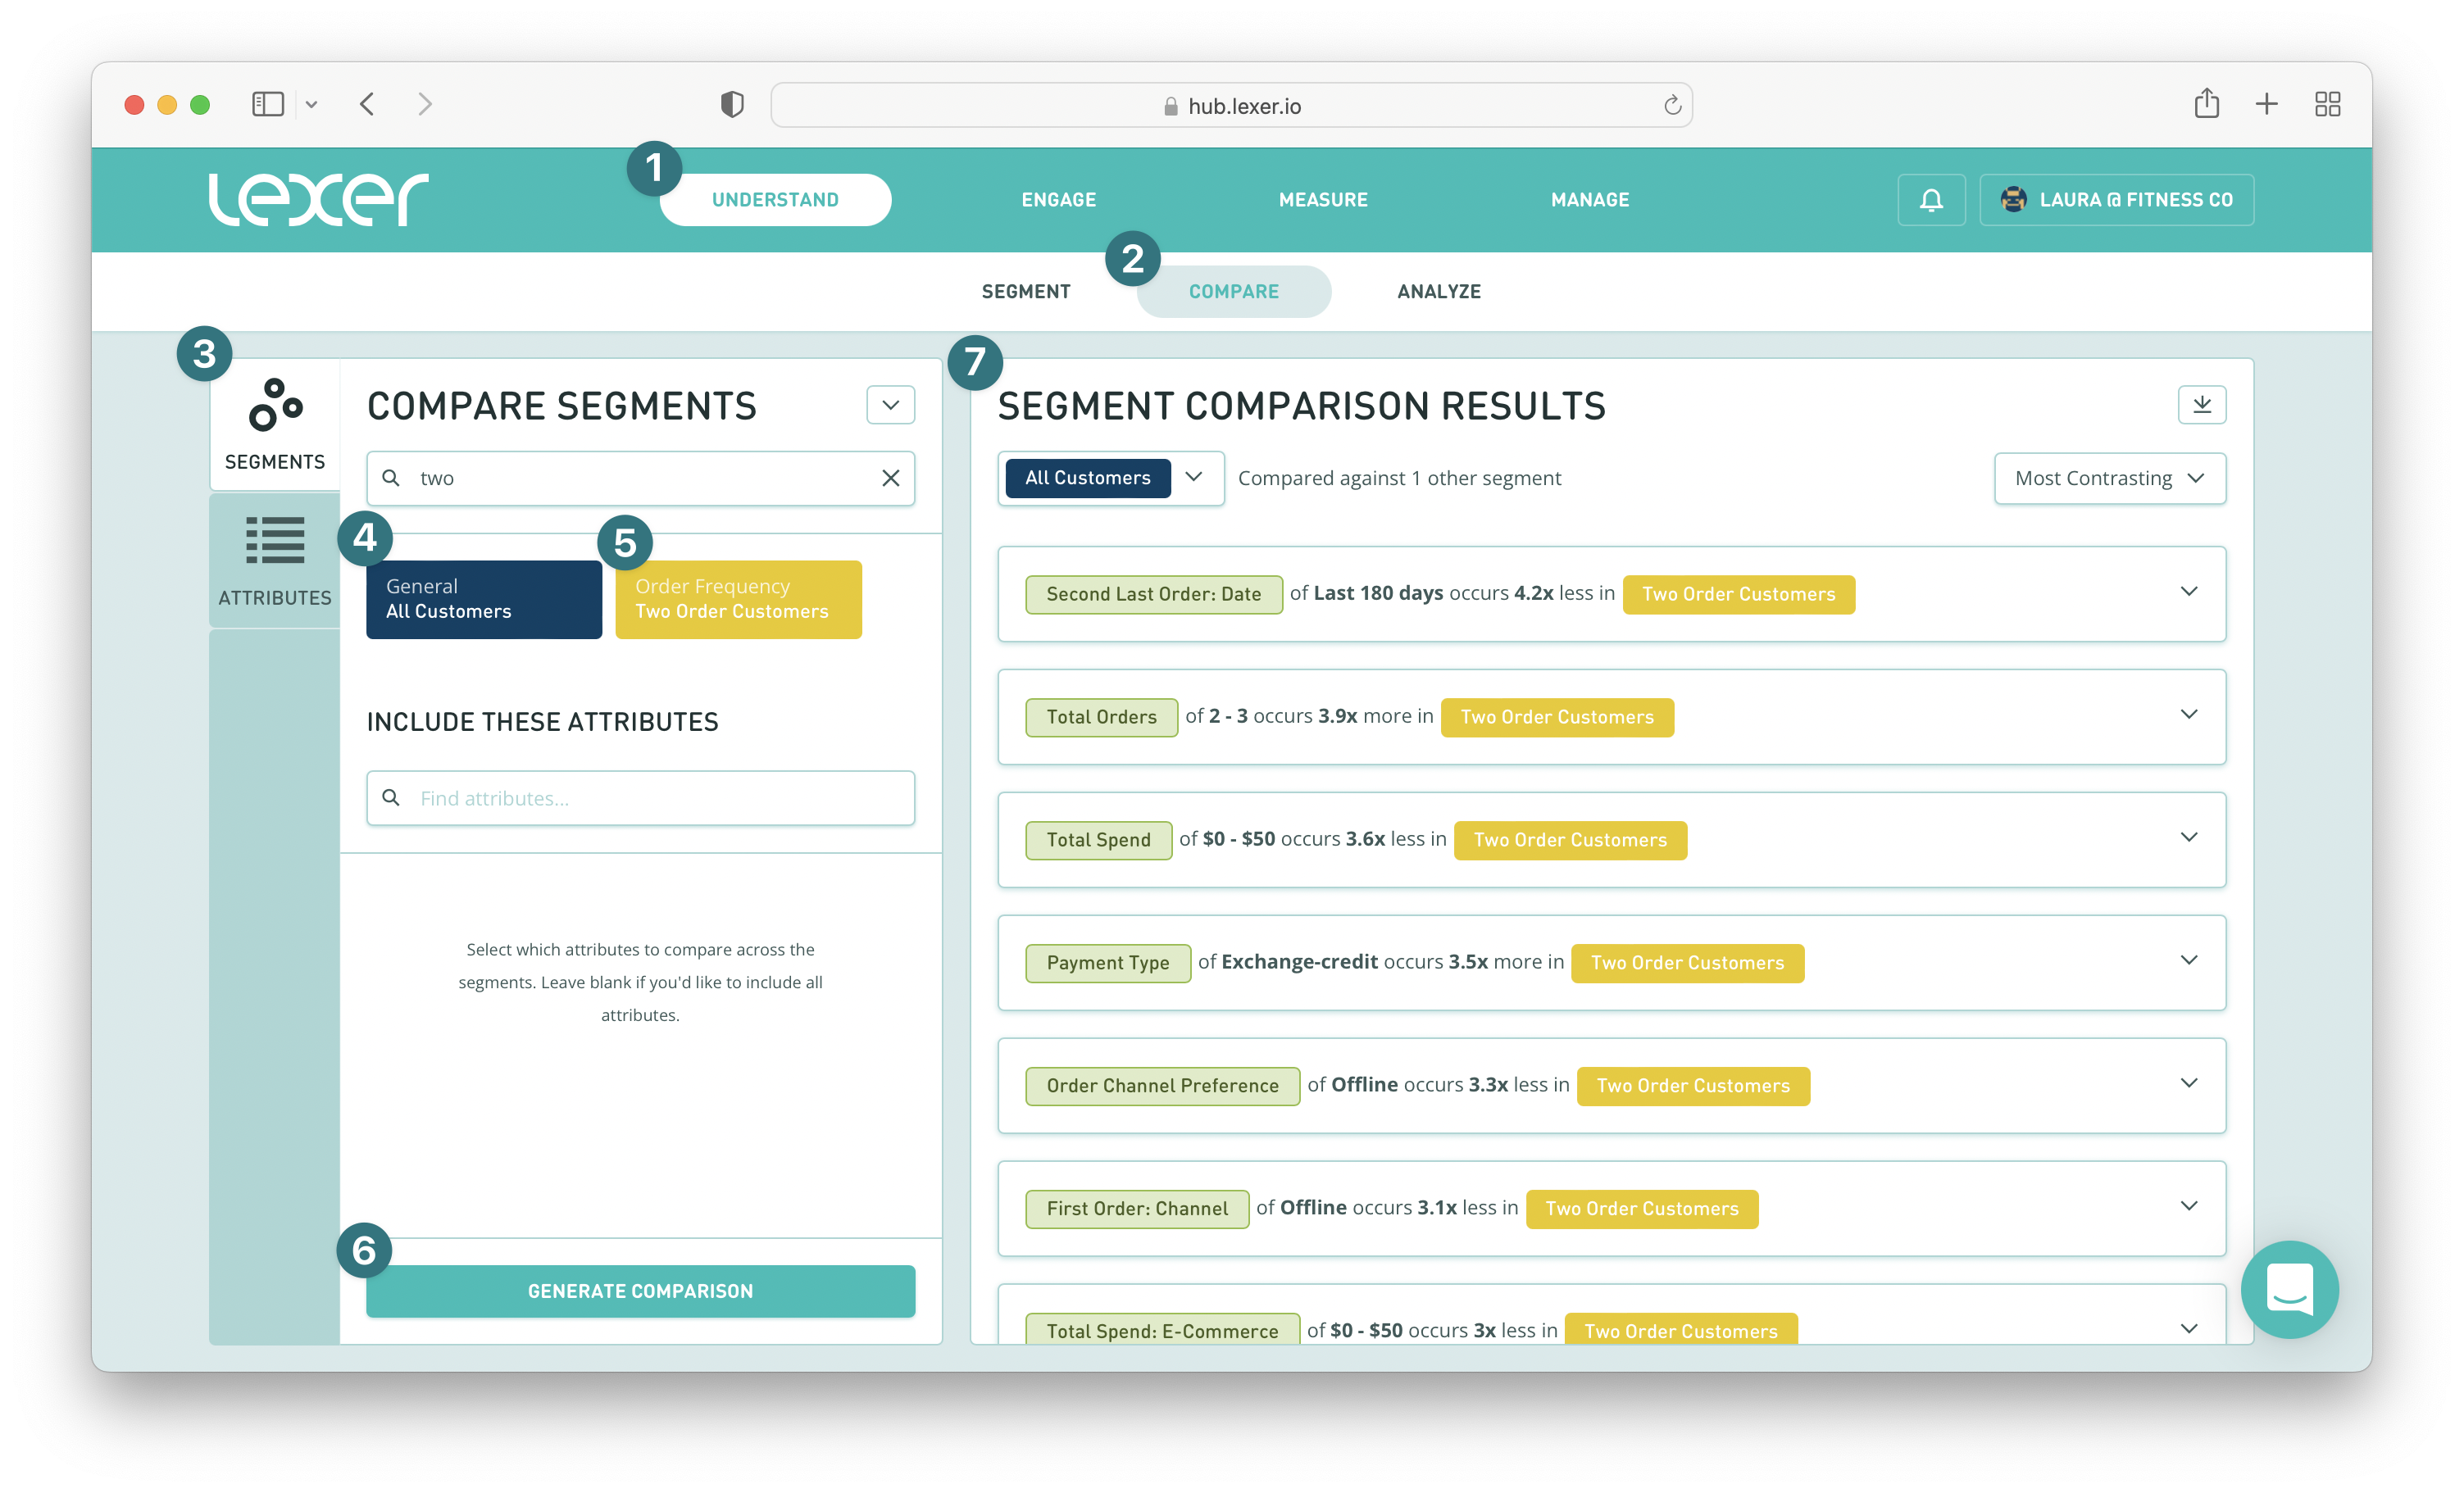
Some key comparisons to look at include:
- Product Name, what products are your 2-time buyers purchasing? You can then add these products to your messaging.
- Order Channel Preference, do they prefer to buy in-store or online? You might want to offer an incentive, such as a discount, depending on the channel preference.
- Gender, are your 2-times buyers more likely to be female, or male? You might want to adjust your messaging depending on the result.
- Generation, how old are your 2-time buyers? Again, you might want to adjust your messaging depending on the result.
Once you’ve gathered your insights, you’re ready to activate your 1-time buyer audience. If you need a refresher we have more information here.
Tracking growth campaign success
You now have your 1-time buyer segment, and the tools to create some truly personalized campaign messaging. But how do you actually measure success once you’ve run your campaign?
Track is the place to go because you can set up campaign success dashboards and then measure the data that comes in over time.
Start in the Segment Builder
First, you need to create your campaign success segment. To do so, add the following attributes to your Segment Builder in the PROFILES MUST HAVE ALL OF THESE section of the builder:
- Included In Audience > Activation name you used for your 1-time buyer conversion campaign.
- Order Date > Since > Campaign start date.
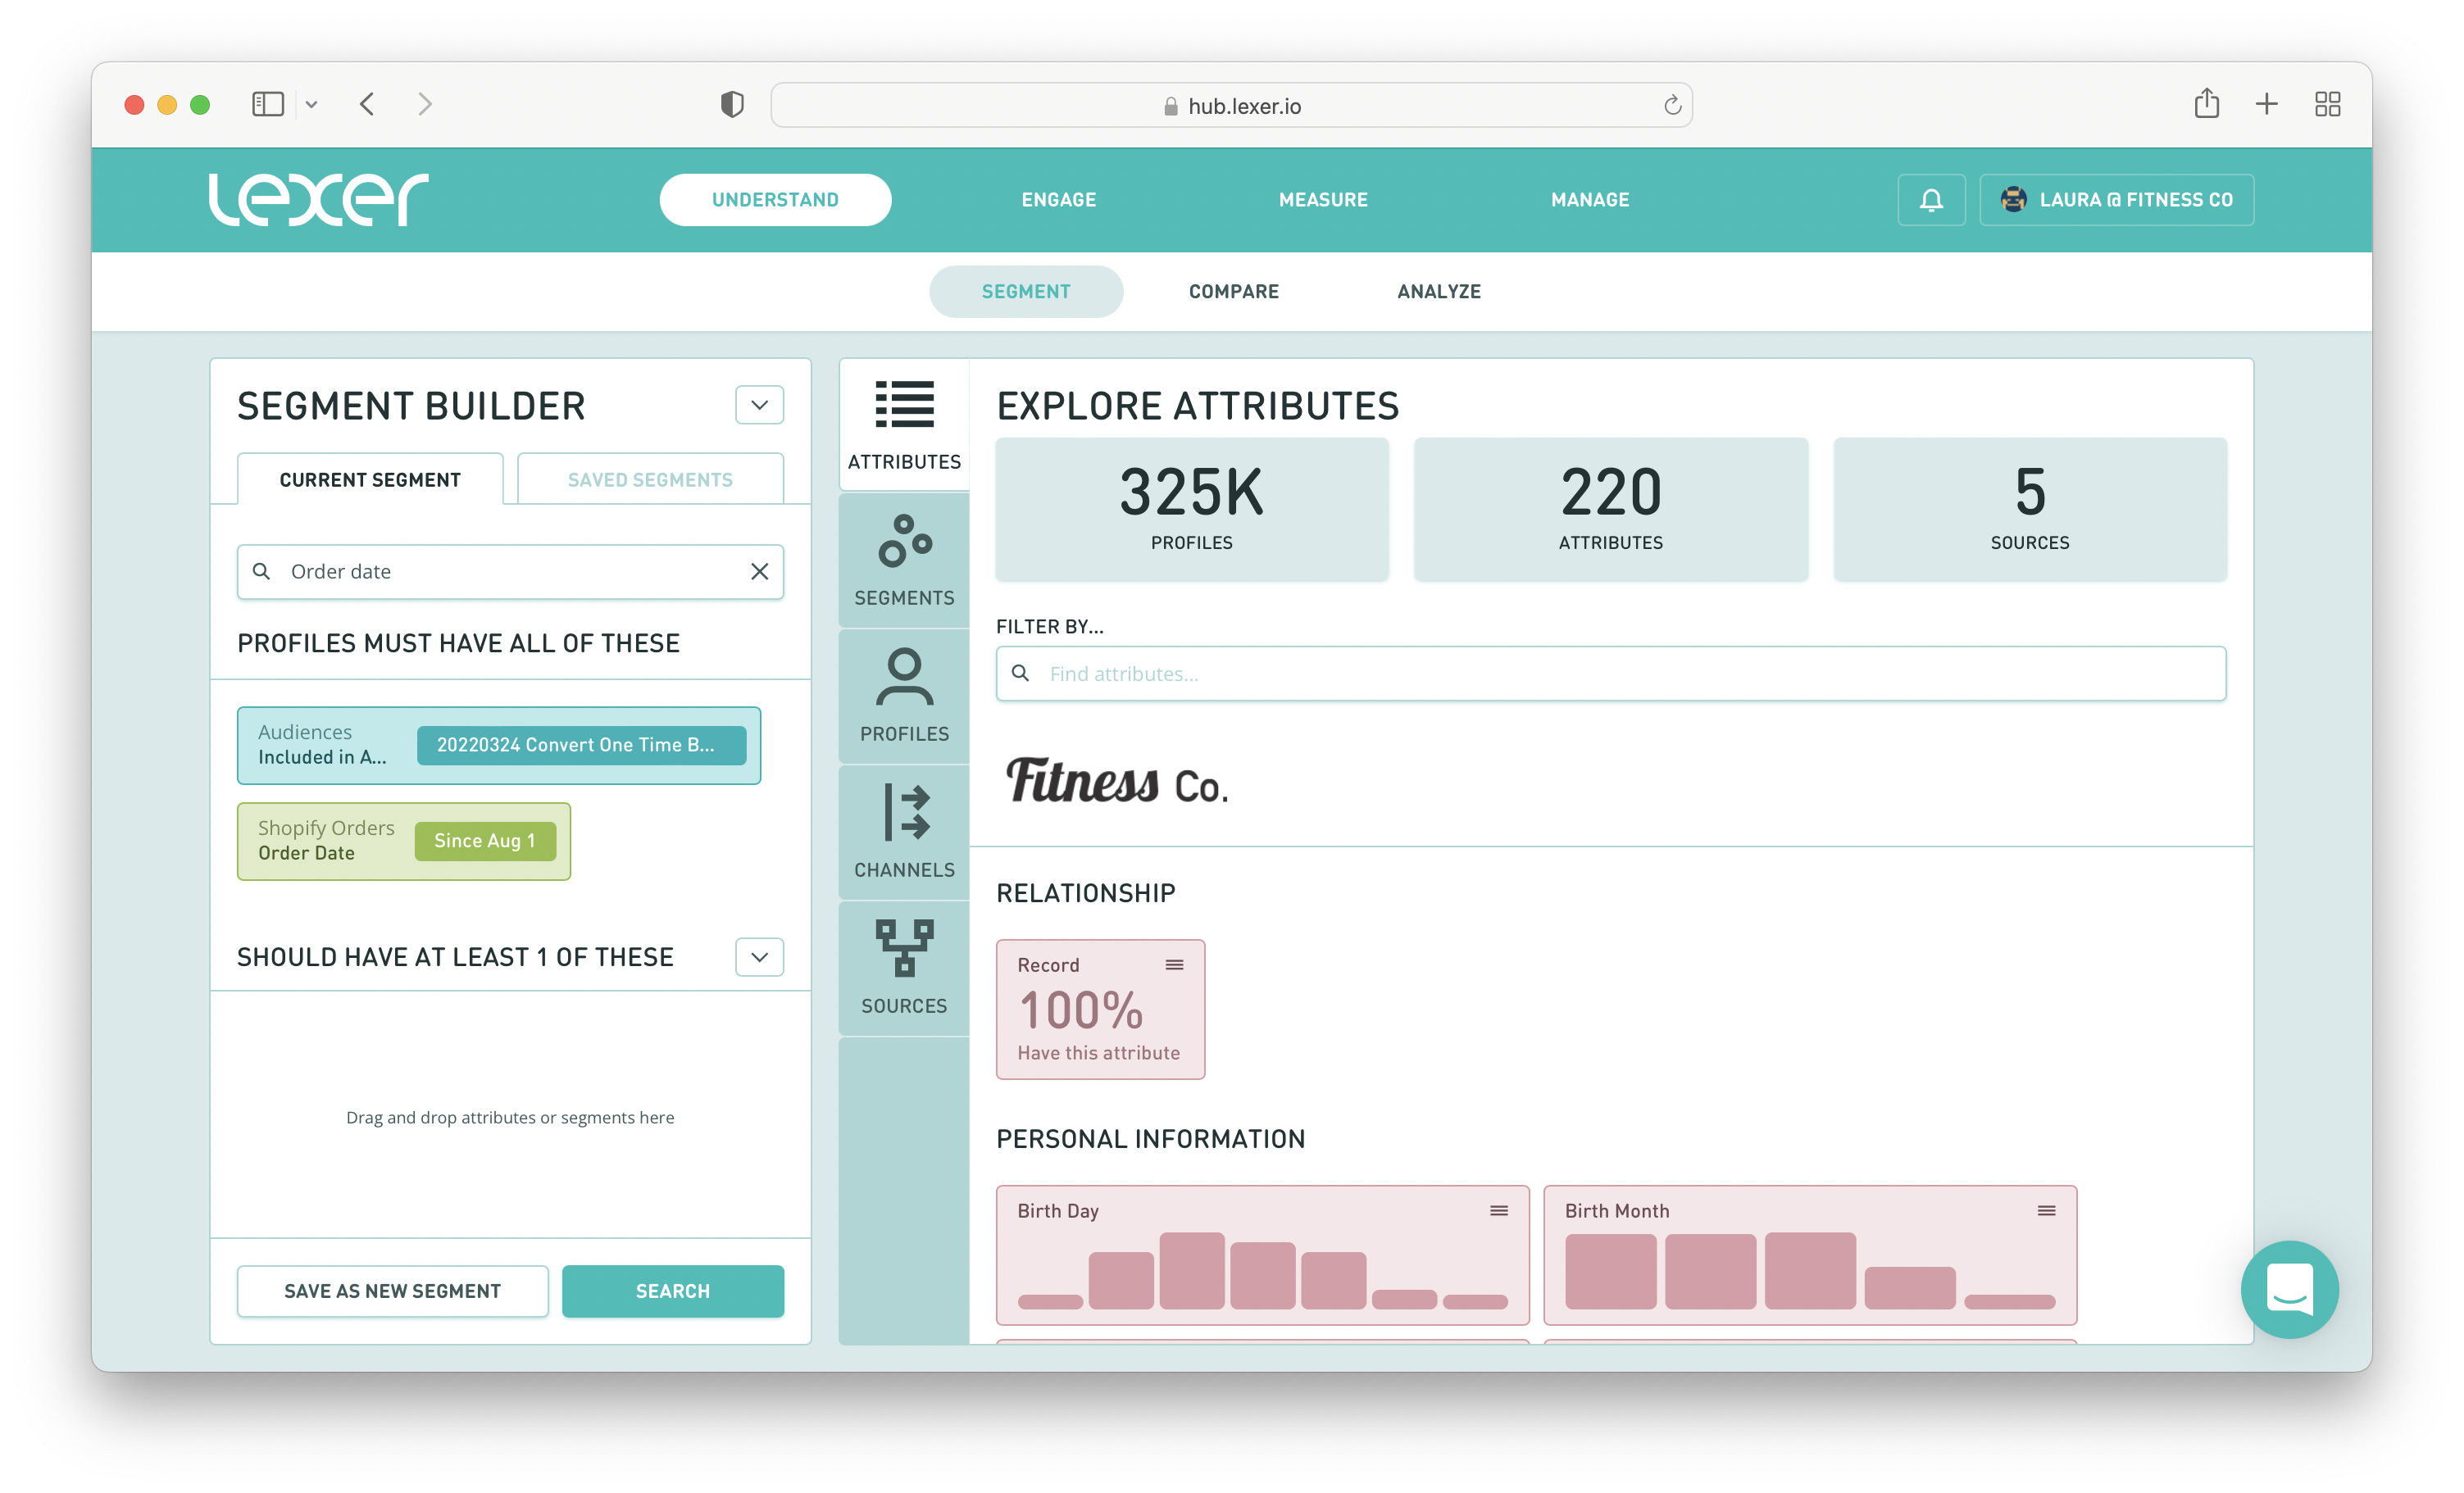
What this query is searching for is customers who have been sent your 1-time buyer conversion campaign and have since made a purchase.
Once this is done you can save your segment and start to create your campaign metrics.
The next step is to set up your metrics!
Setting up your metrics
Select the campaign segment you’ve just created, and then navigate to METRICS.
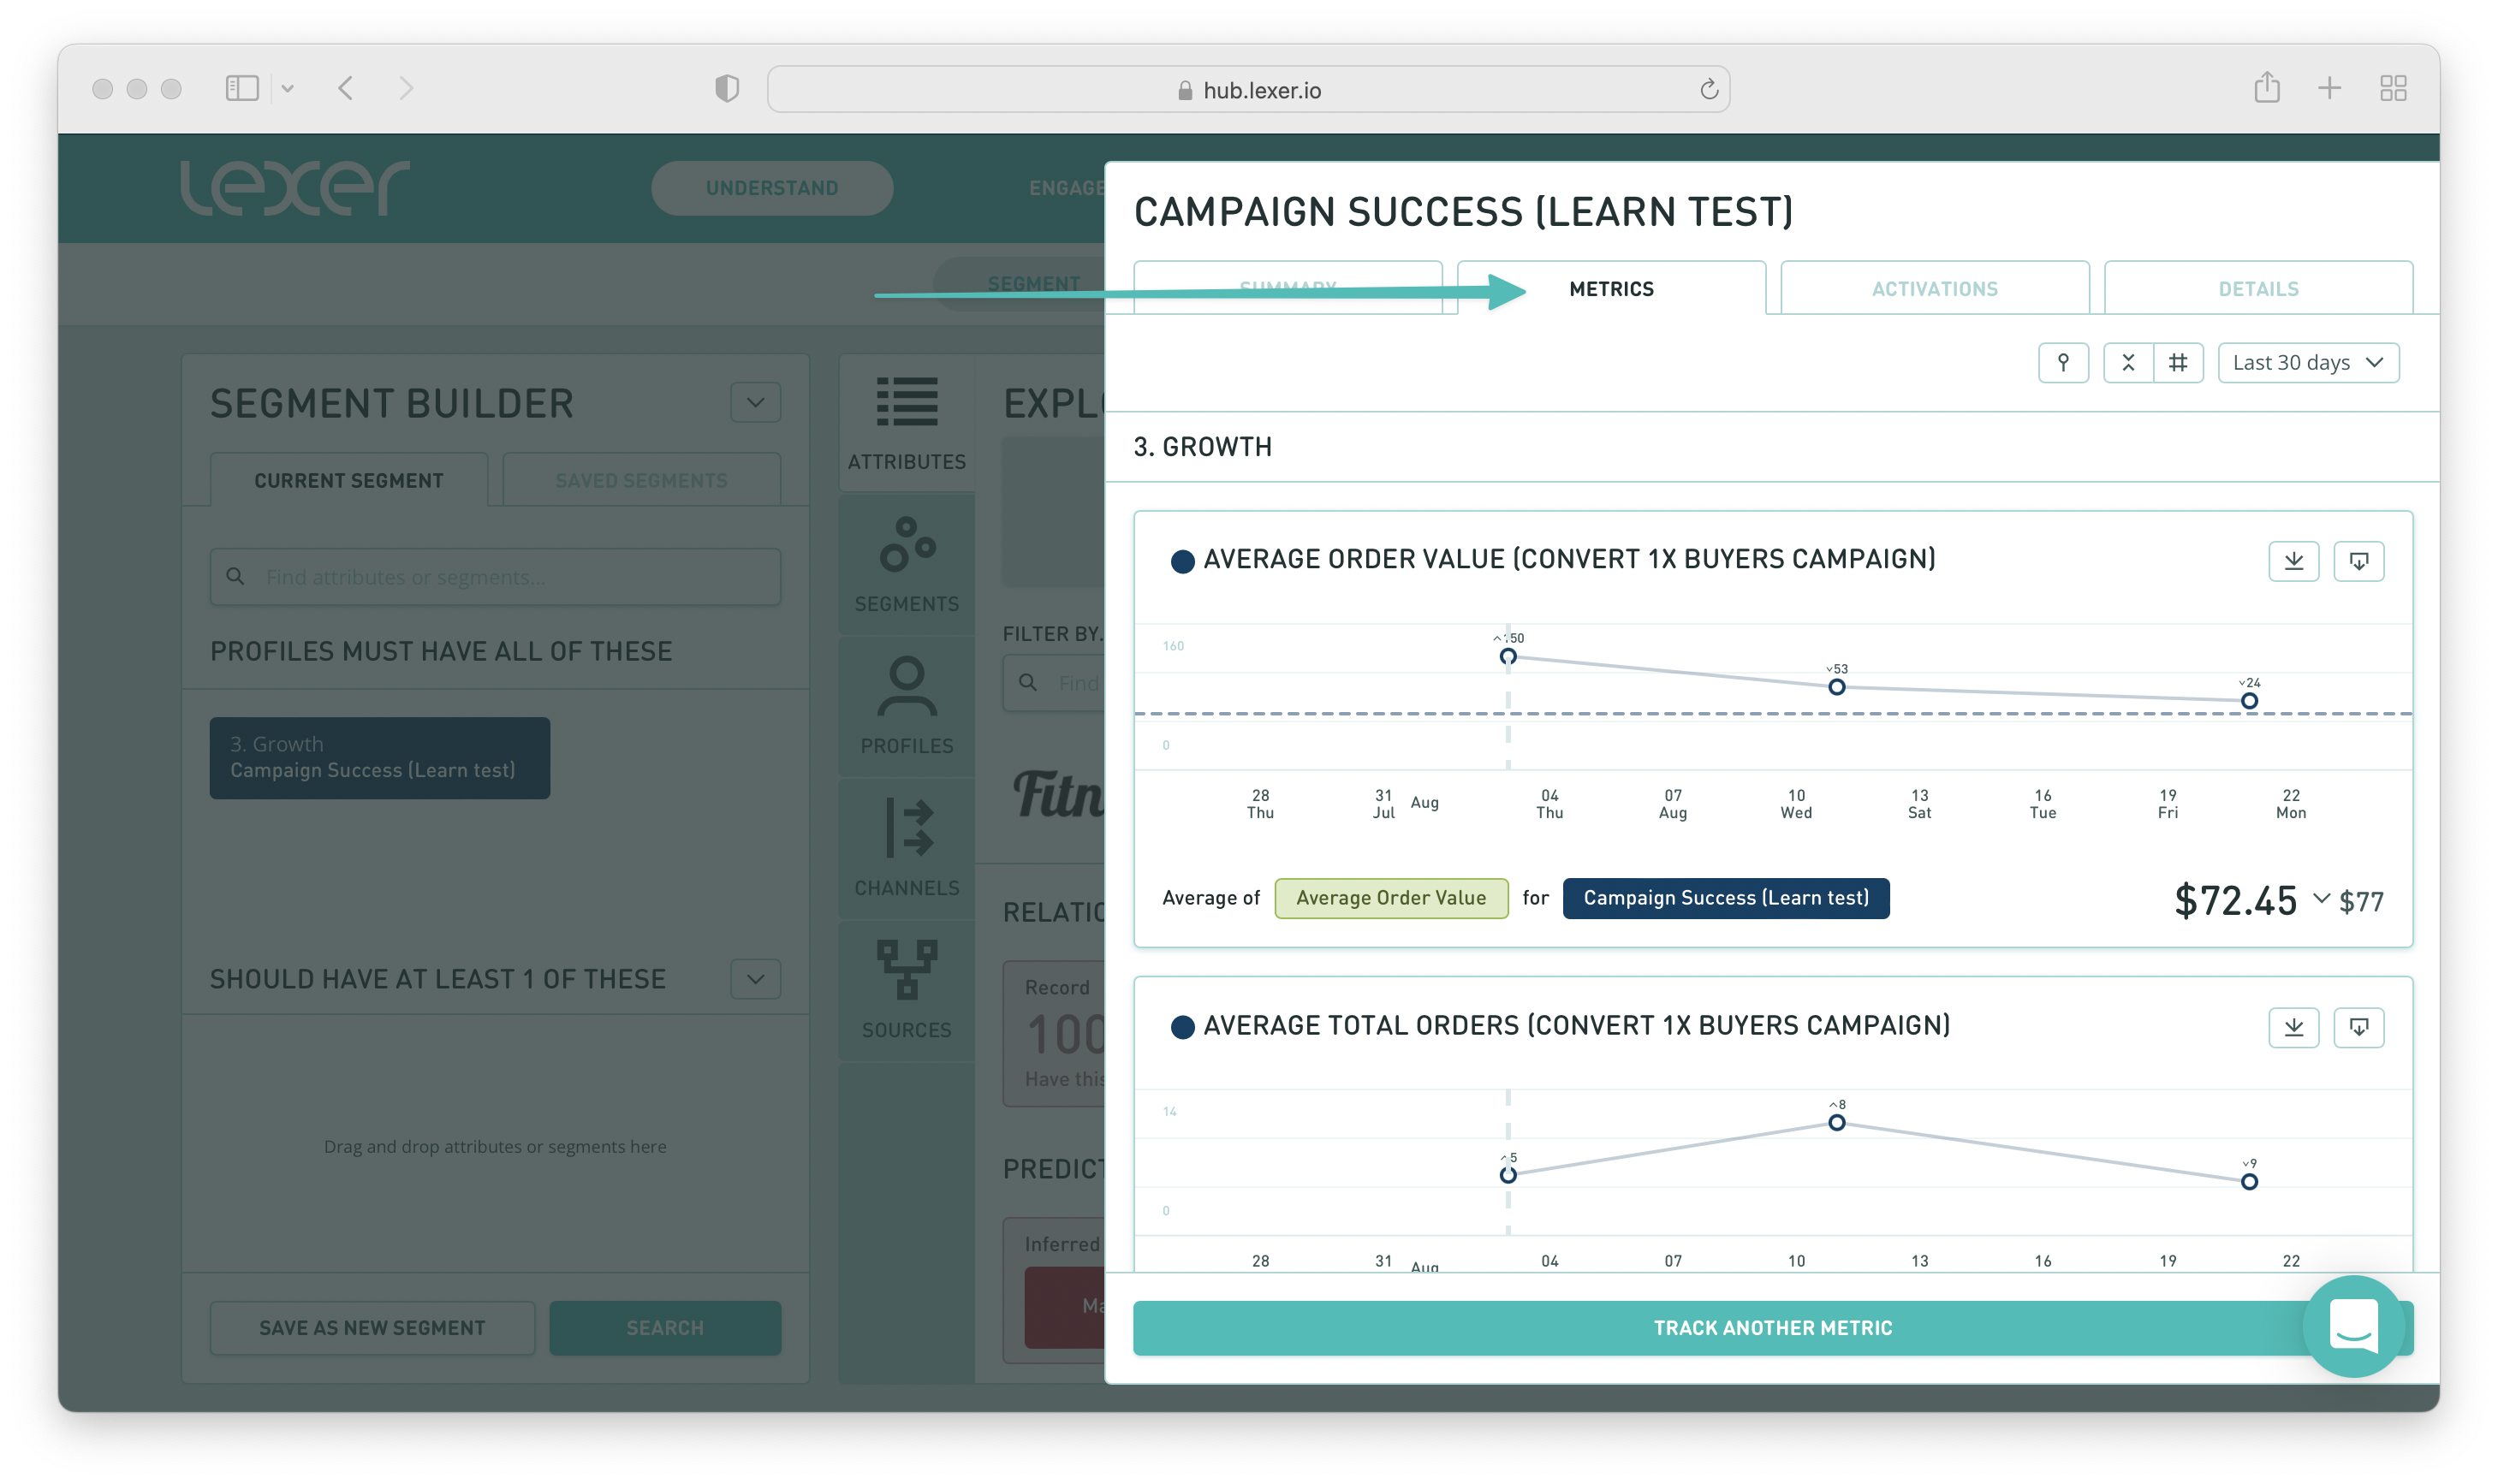
We suggest creating the following metrics for this segment:
- Total population, so you can see how the segment grows over the lifetime of the campaign.
- Average order value
- Average total orders
- Average total spend
If you need a refresher on how to create your metrics, check out our Track overview article here.
Now that your metrics are set up you can put together your dashboard.
Creating your Track dashboard
Navigate to Measure > Track and then click on NEW DASHBOARD.
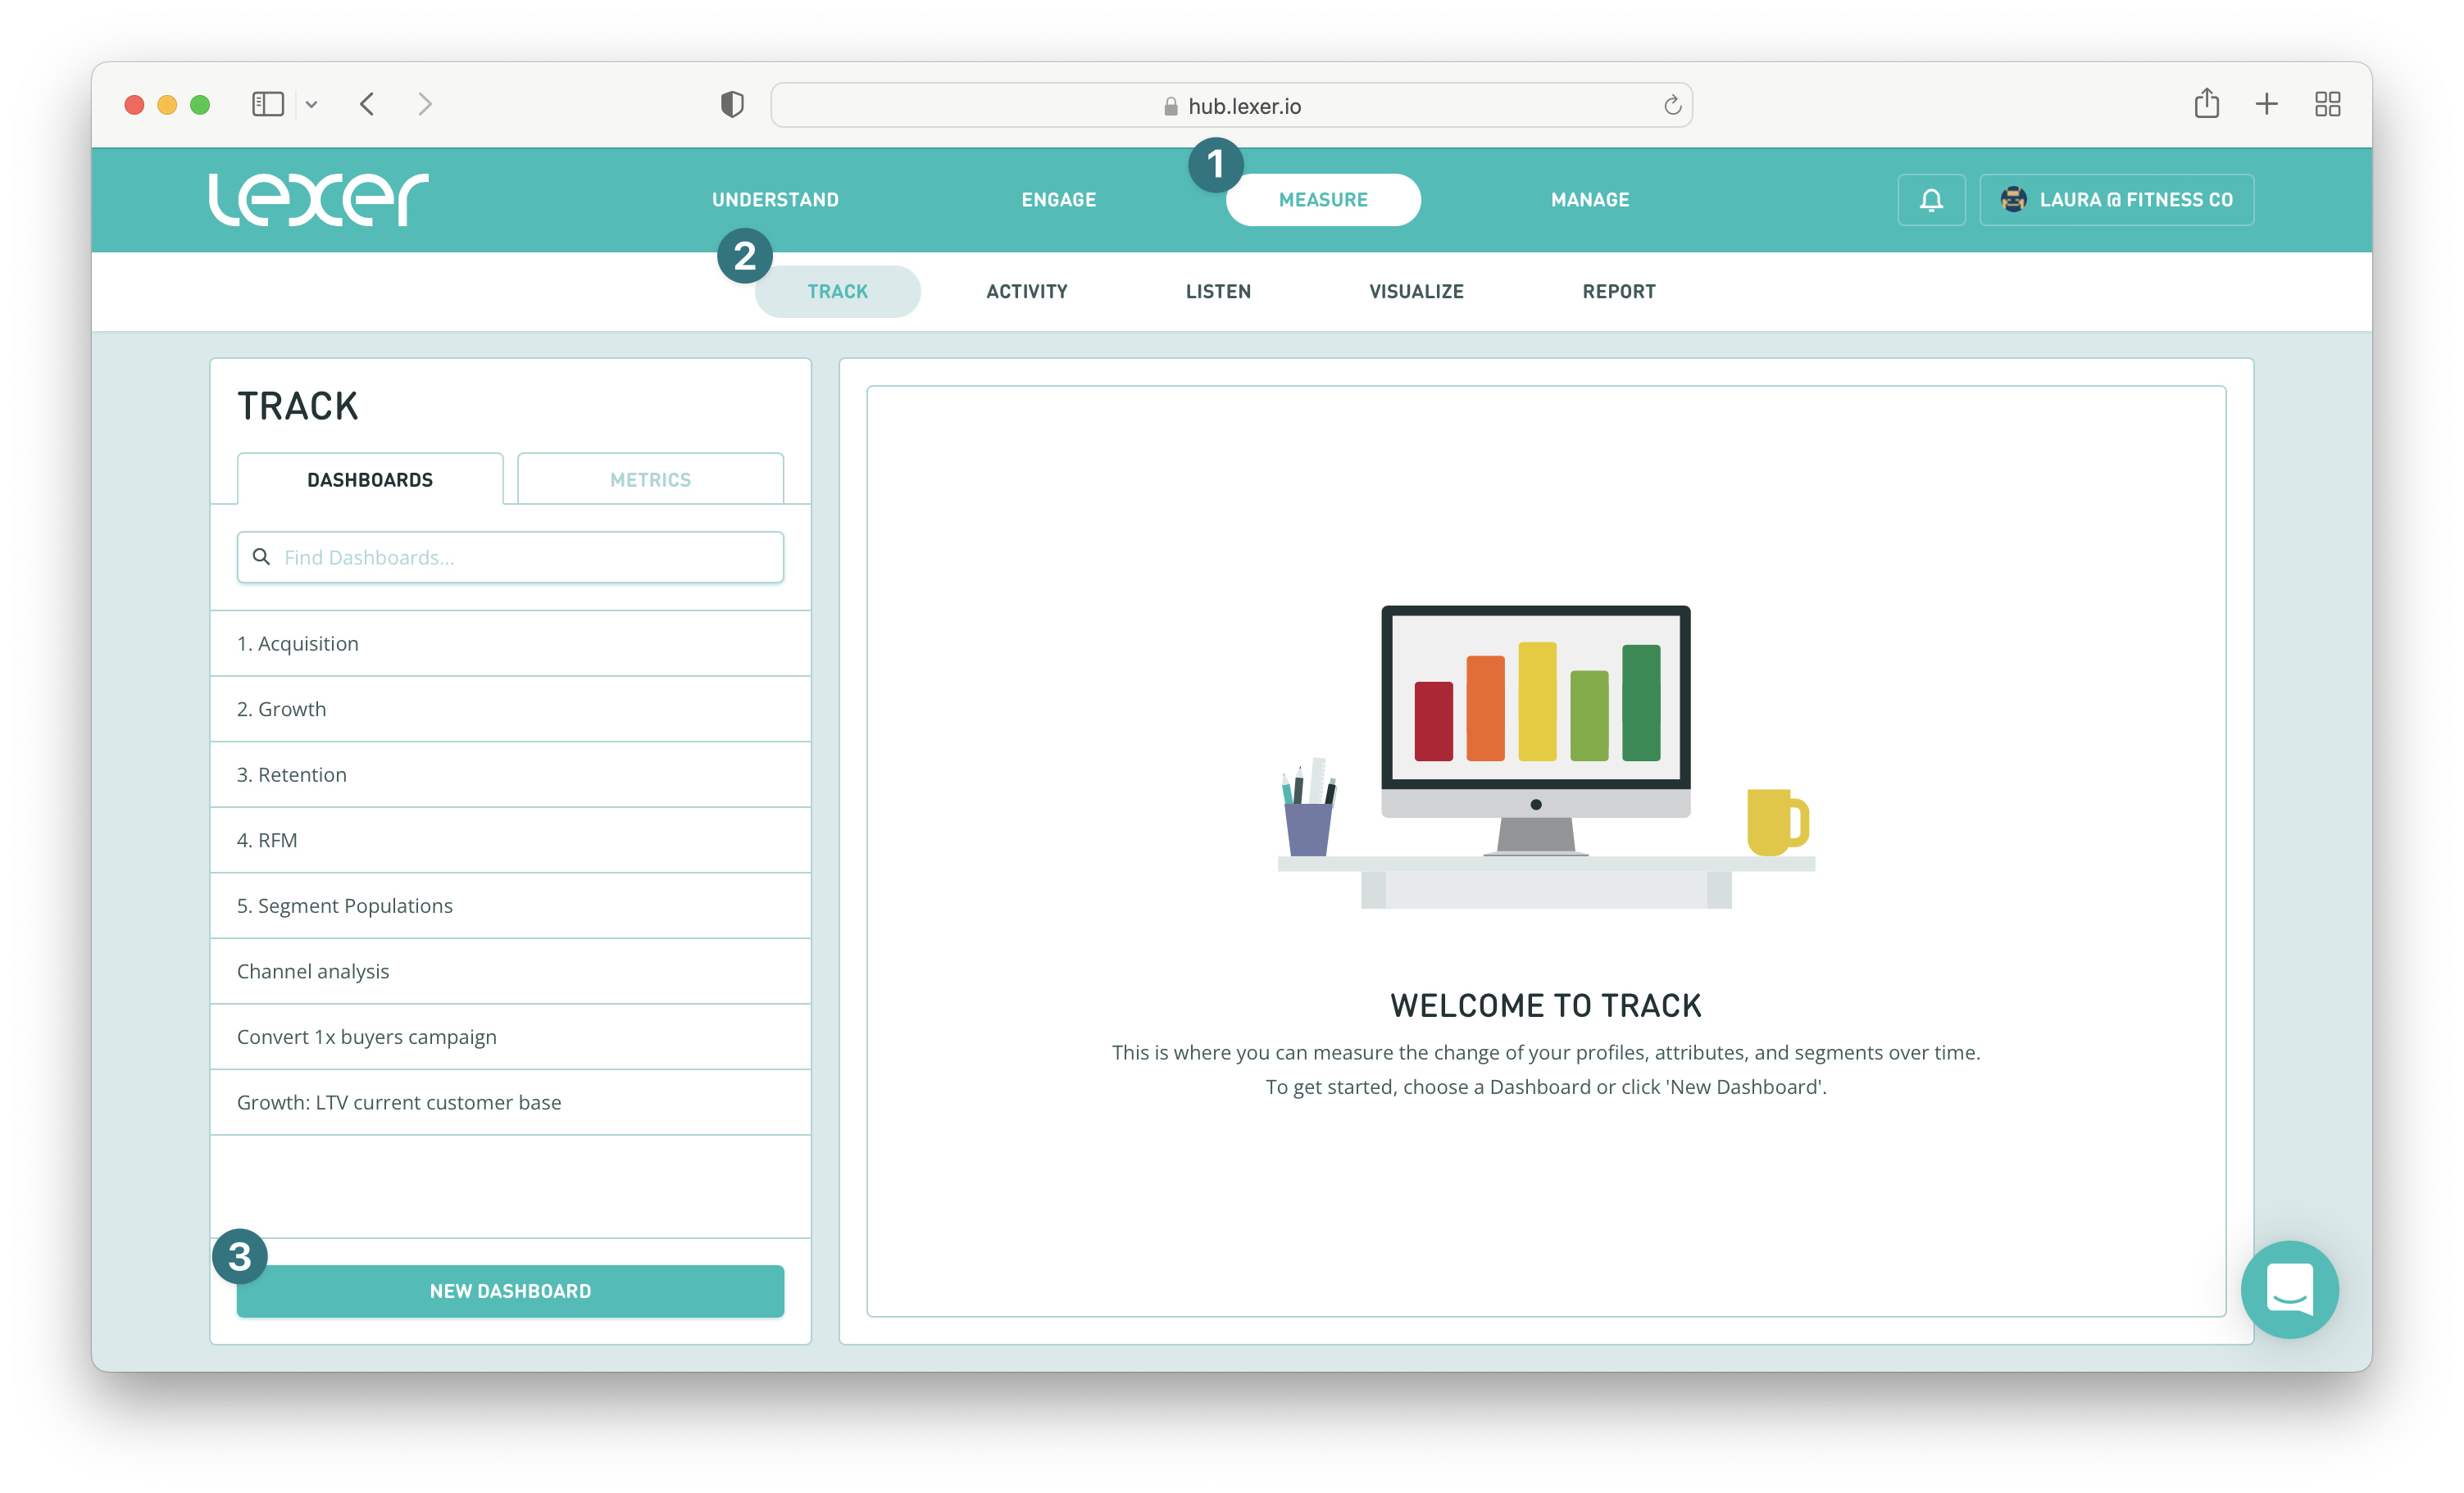
Fill in the following details:
- Name, the name you would like to give your dashboard, generally for a campaign success dashboard we would suggest adding the name of the campaign you’re tracking here.
- Category, the category this dashboard falls under, growth or retention for example.
- Description, a brief description of what this dashboard is tracking.
- Color, can be anything you like, or follow guidelines your team might have.
- Groups, who has access to this dashboard.
Then hit Save, and your dashboard is ready to configure.
Search for the metrics you configured earlier and then drag and drop them onto your dashboard.
You can choose how you want to view your metrics, so feel free to edit them as needed.
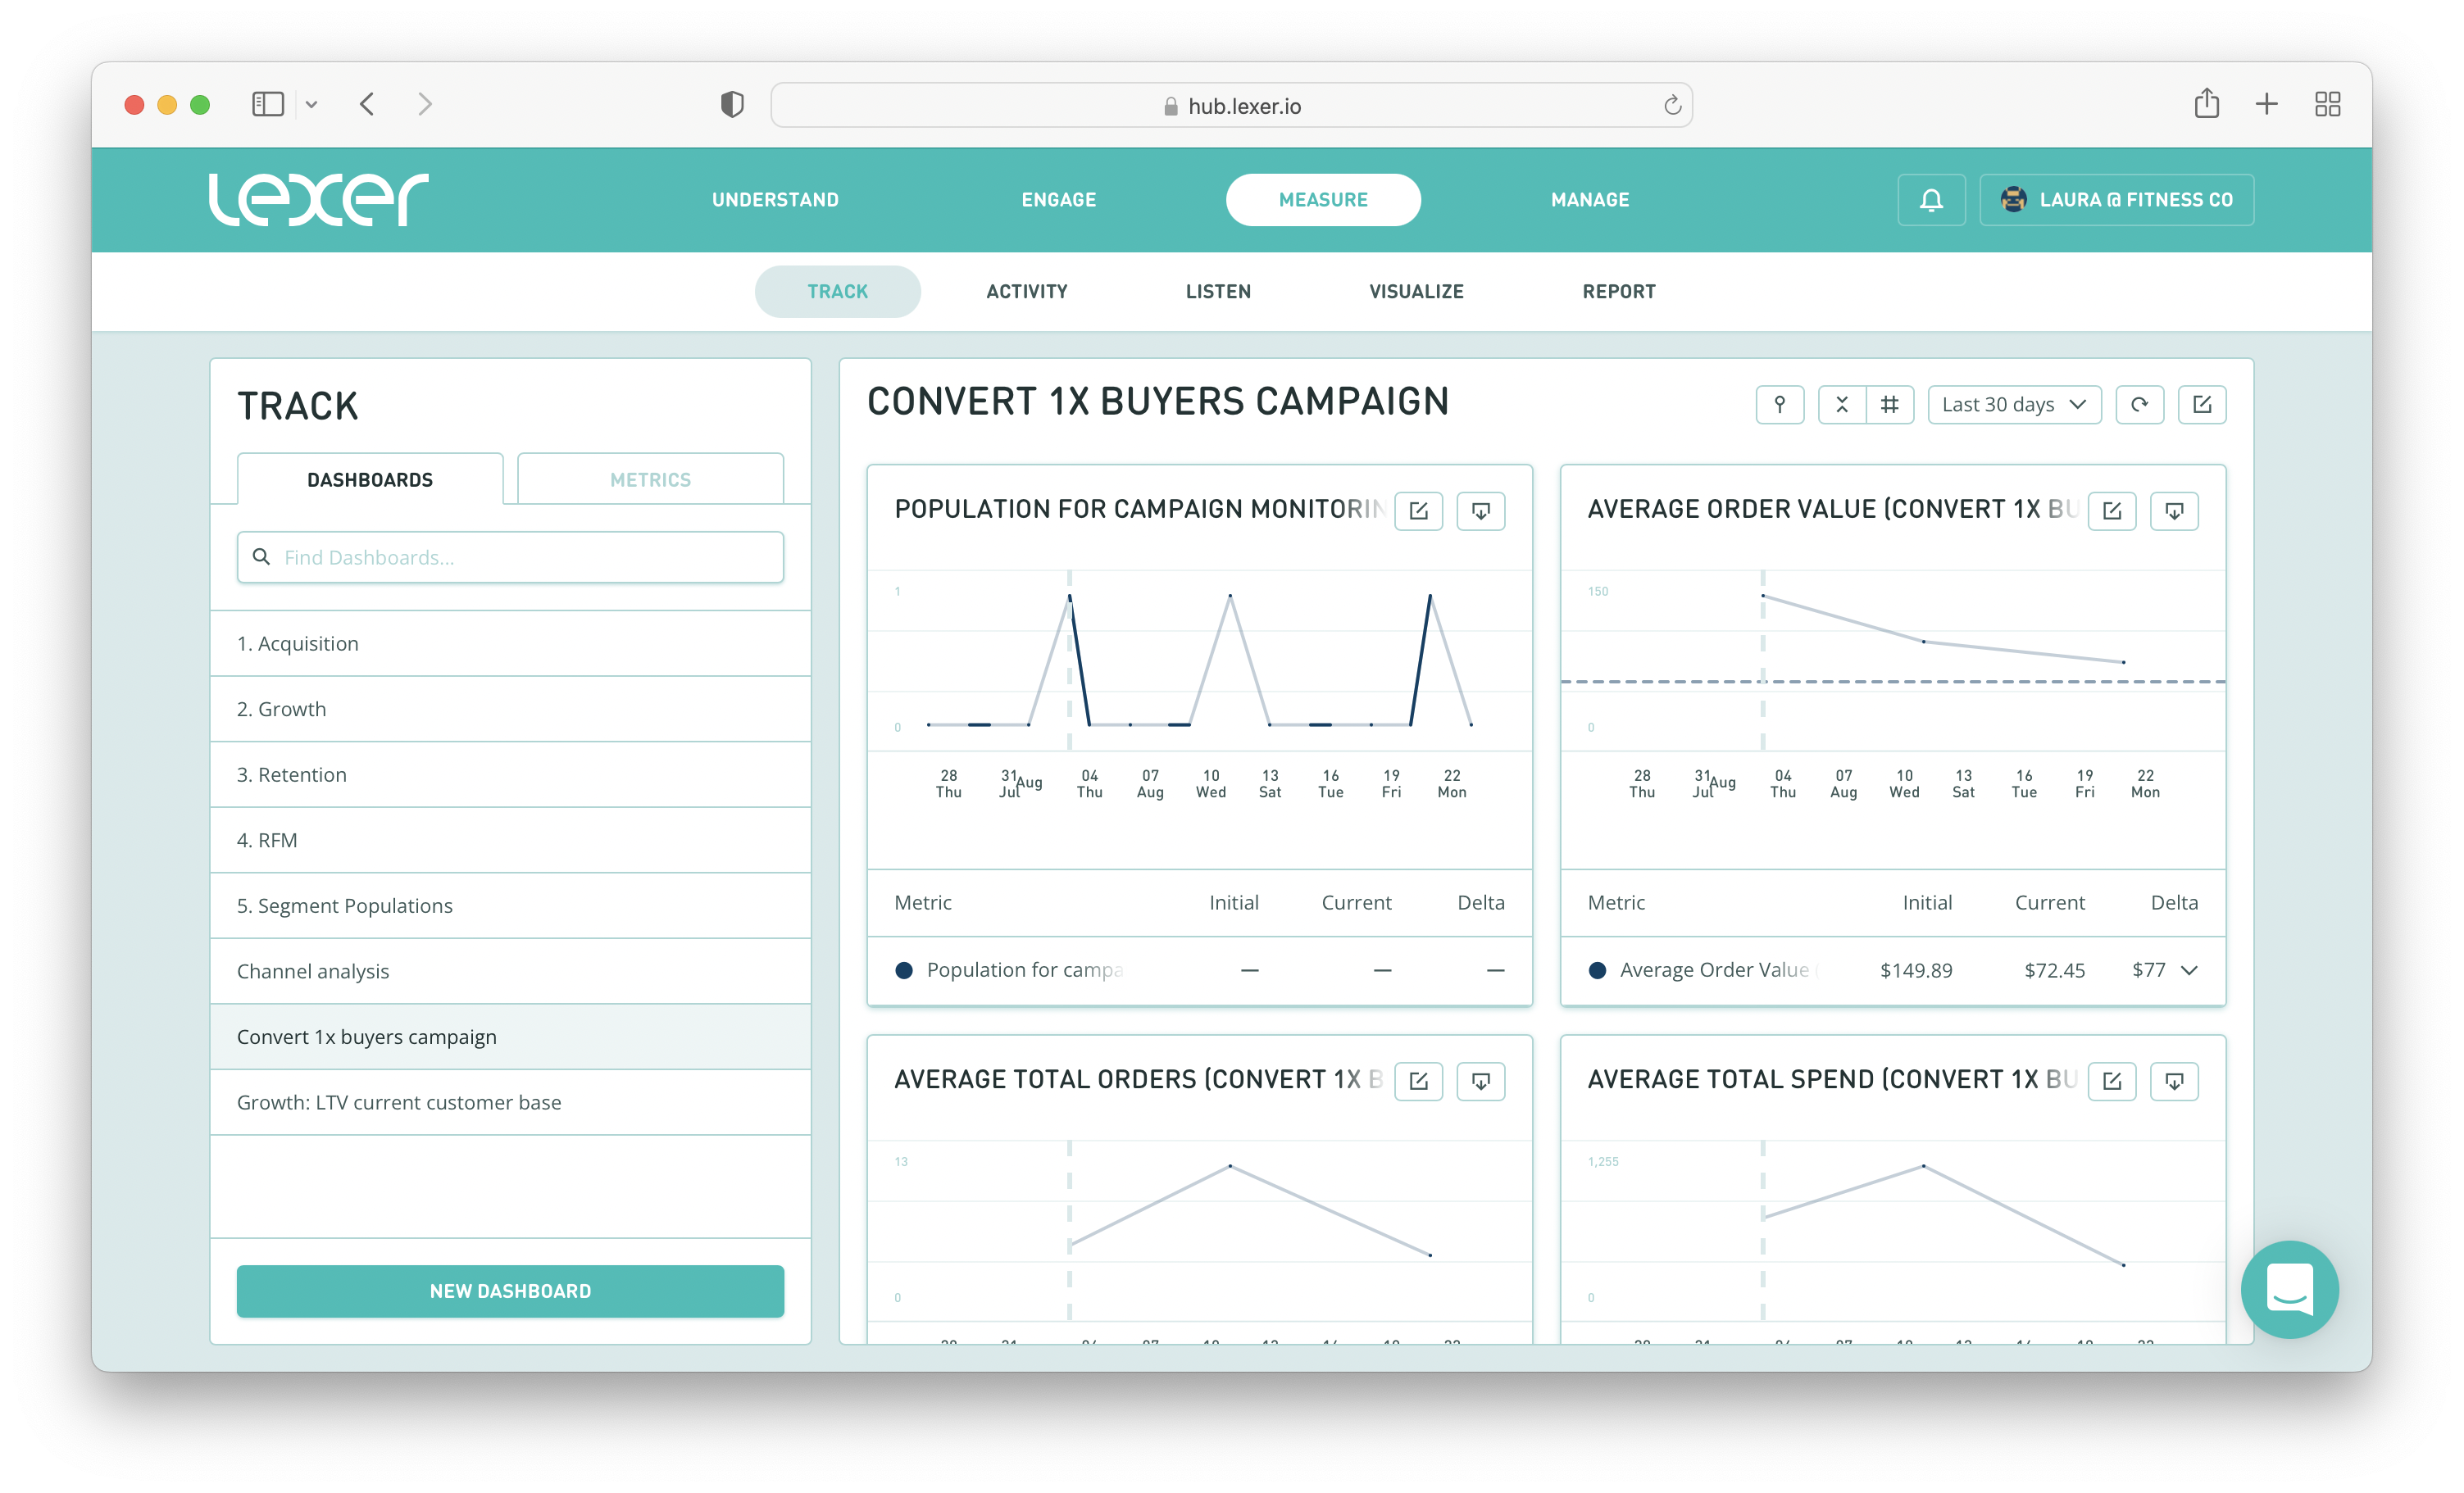
You can now monitor these metrics over the life of your campaign and see how successful you’ve been!
Lexer tips!
Before we finish up, let’s run through a couple of tips to get the most out of your campaign dashboards.
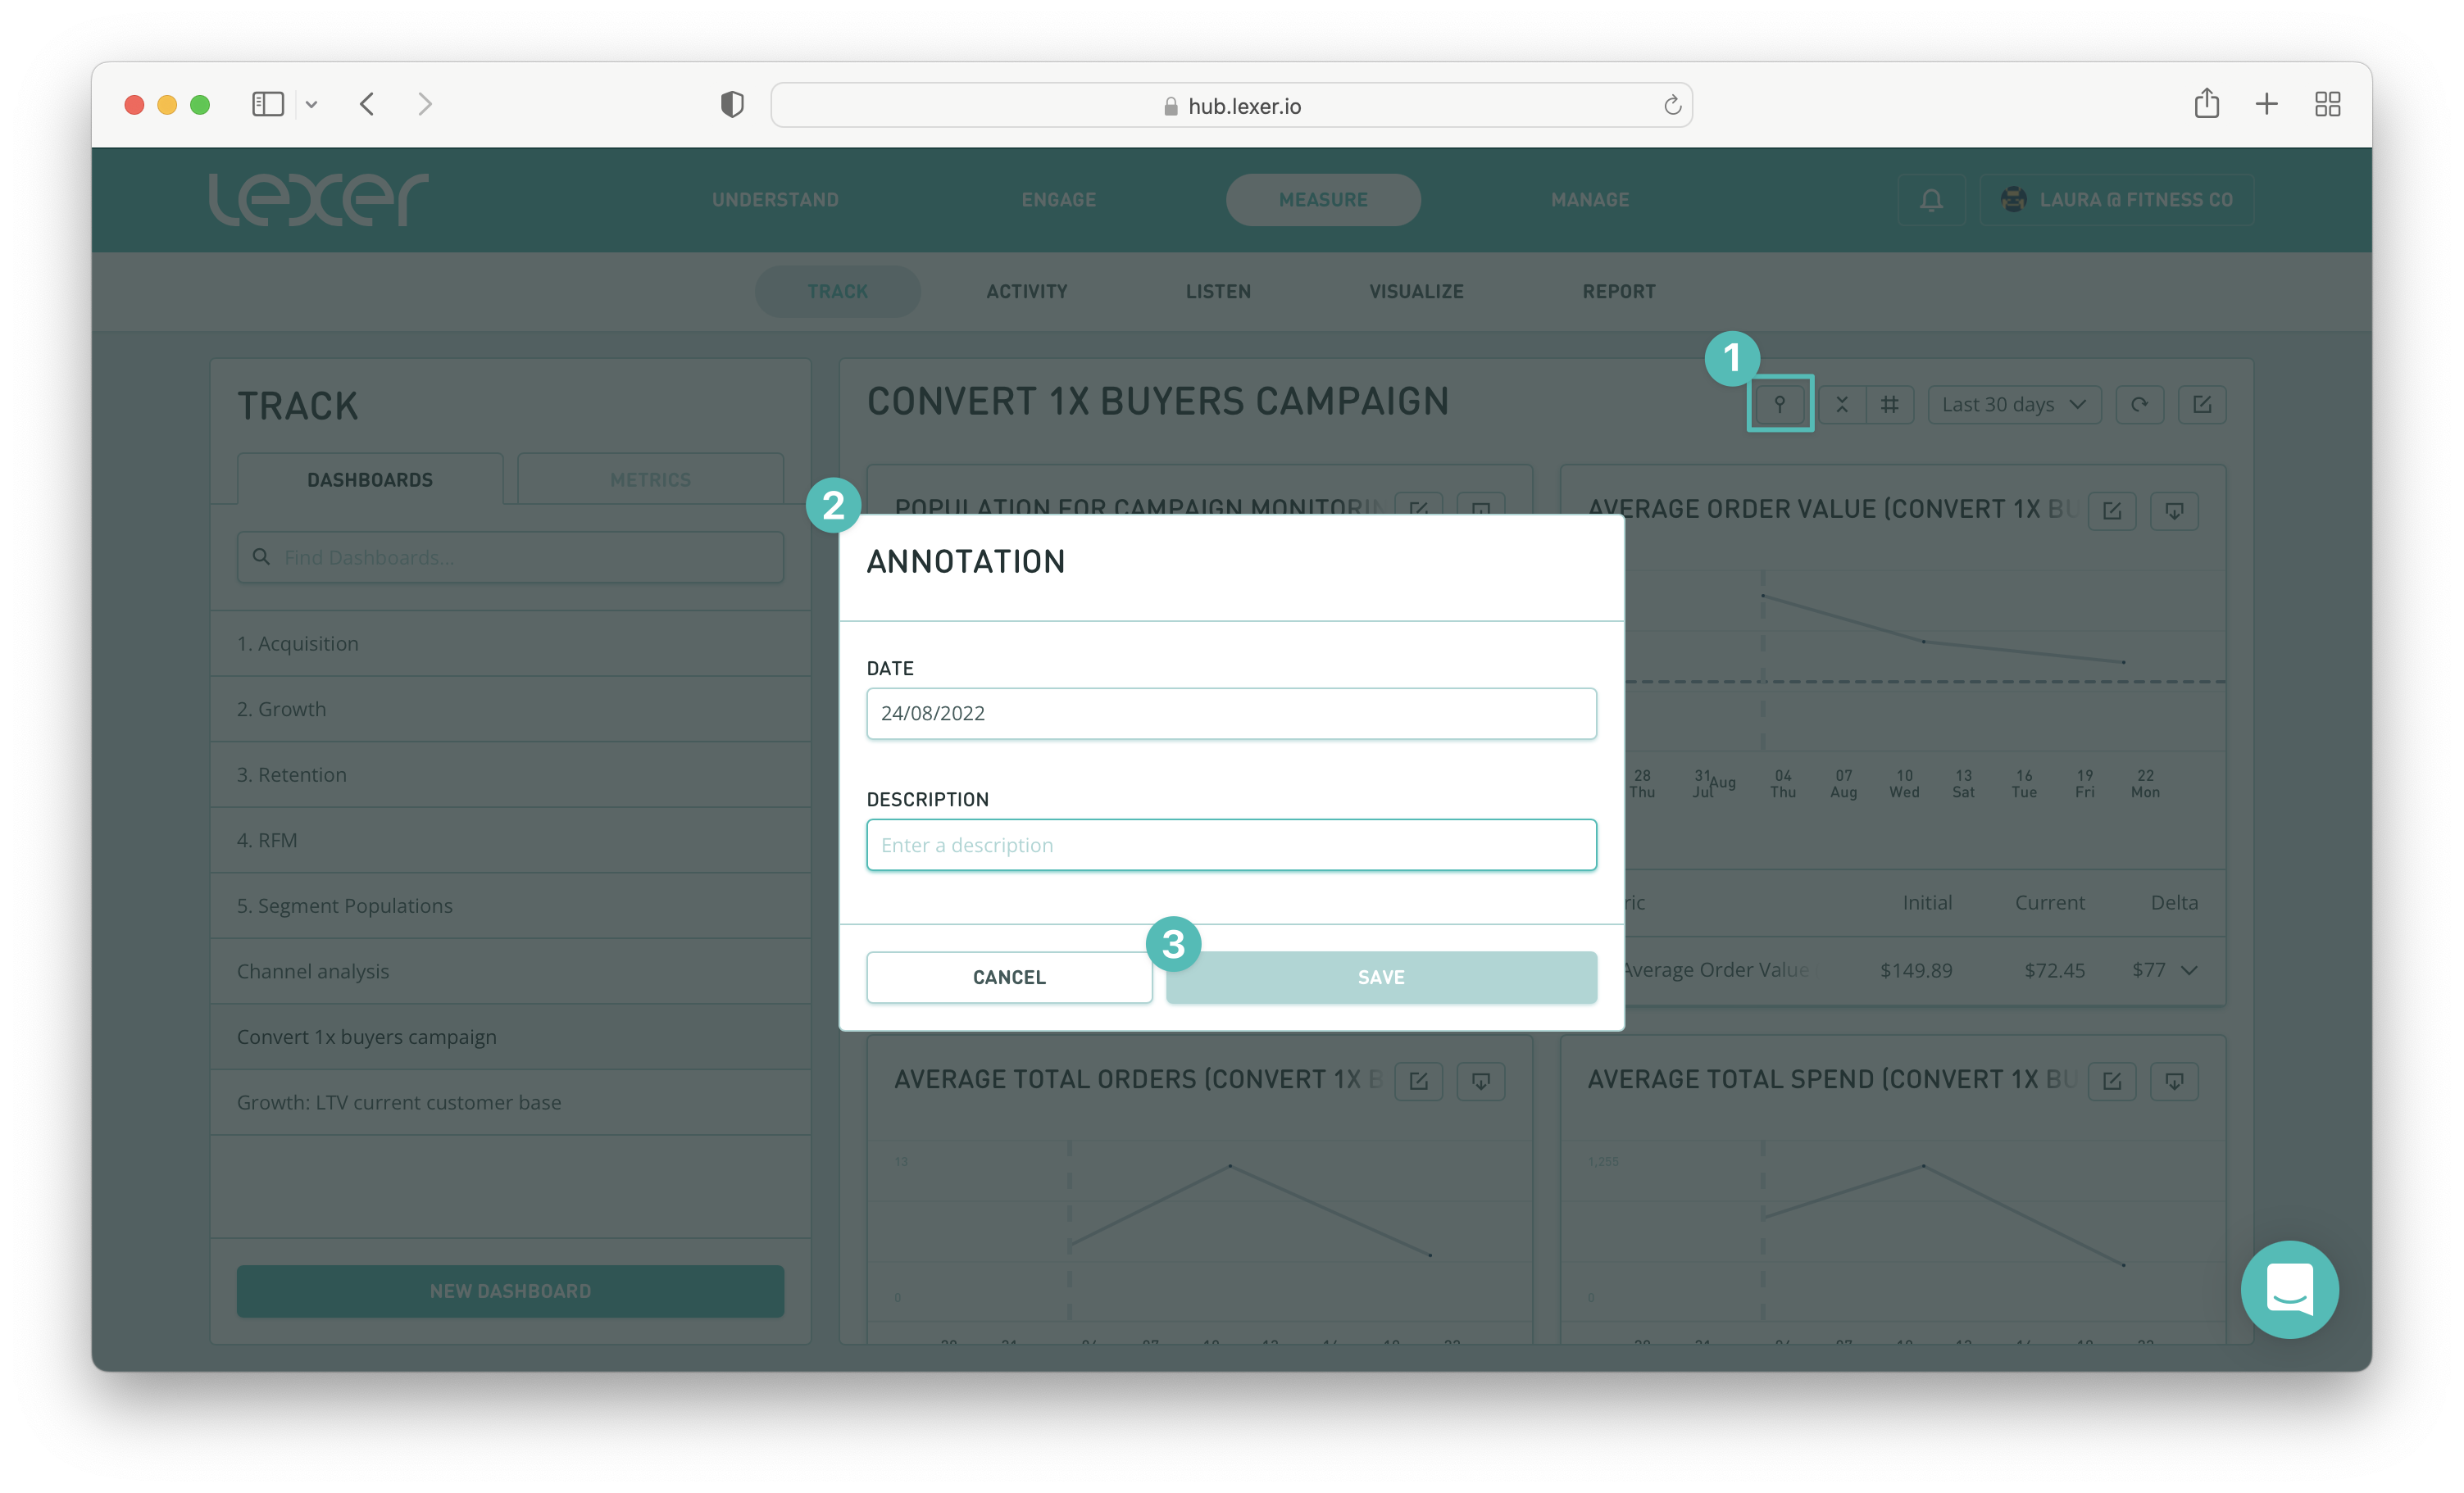
Firstly, you can add annotations to your cards. Simply click on the annotate symbol, double check the date and add your note. Hit Save and now you’ll have a record of your annotation.
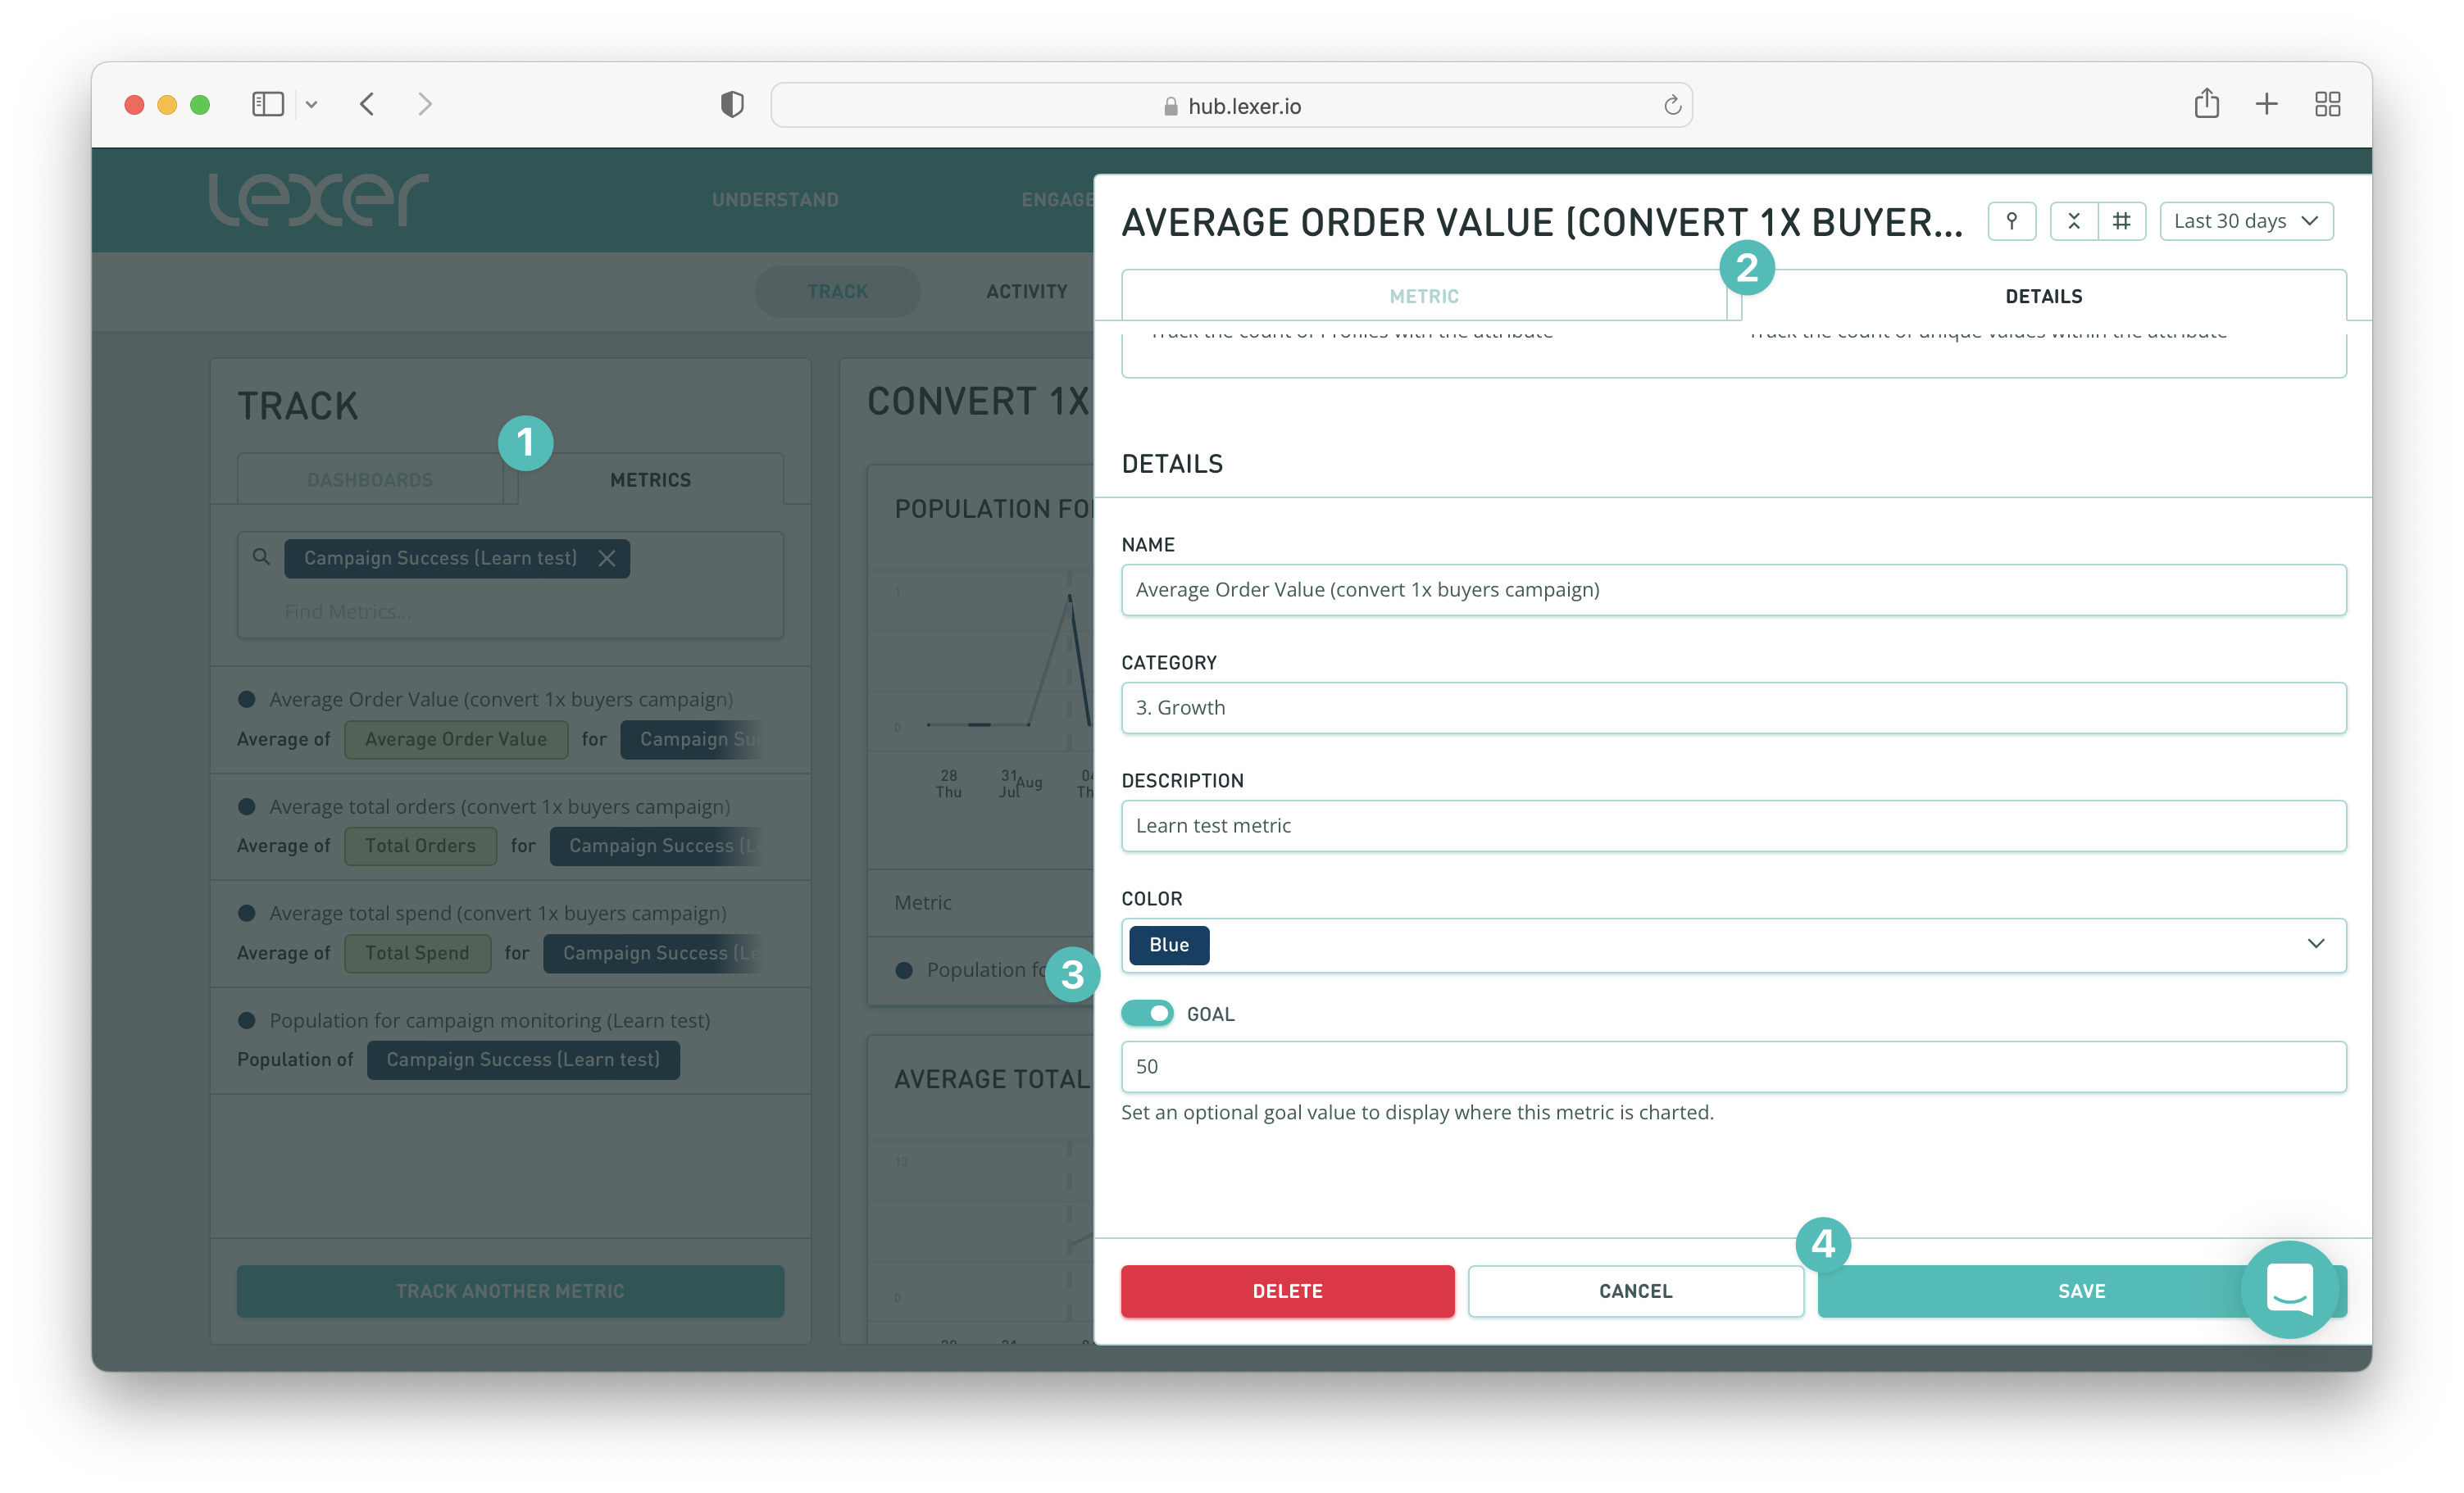
You can also add a goal within your metric settings. This is great for keeping track of campaign targets you might set.
Simply navigate to the metric you wish to set the goal for, toggle the GOAL setting on and then set your number. You can then view the goal on your metric.
Increasing your customer lifetime value with Lexer
In this article we’ve shown you just how easy it is to plan and implement your growth strategies with Lexer!
You are now able to identify your 1-time buyers, create growth campaigns with personalized messaging, and track the success of your growth campaigns over time.
If you have any questions, or need any assistance, please reach out to your Success Manager, or Lexer Support (support@lexer.io).

