How Total Spend and Sum of Price Paid differ
These two metrics look similar but answer different questions — knowing which one you're looking at makes it far easier to read correctly.
Total Spend (Found in Segment > Attributes)
This is a Number attribute (represented in an integer or flat format) — a pre-aggregated fact calculated for each profile across their full transaction history. It's built from your Commerce data (which explicitly models Orders and Returns as separate record types), and once calculated it's a single static value per profile that Segment displays as a sum or average when you search on it. Total Spend is net of returns — the calculation processes purchase and return transactions together, so any returned value is automatically deducted from the profile's total. This is true across the profile's whole history and isn't user-configurable.
Sum of Price Paid (Found in Event Explorer)
This isn't a stored attribute. It's the "Sum" aggregation applied on the fly to a price field within whichever single event type you've selected (e.g. Orders or Products) in the Event Picker. It's recalculated live based on your current segment filters, date range, and event filters, and only covers the event type you're viewing. Sum of Price Paid is gross by default, it does not deduct returns, because the Orders and Products event types don't include return line items to net against in the first place. Returns can appear as their own event type in some hubs, but there's no automatic reconciliation between that and Orders and Products, if Return events are available, you'd need to manually query and subtract it.
Expect Total Spend and Sum of Price Paid (on Orders and Products) to diverge whenever a customer has any returns — Total Spend will be the lower, "final" number, and Sum of Price Paid will run higher since it reflects gross purchase activity in the selected window.
So, the core differences:
- Returns - Total Spend is always net of returns. Sum of Price Paid is gross unless you've explicitly built in a return deduction.
- Time - Sum of Price Paid is a live aggregation scoped to an event type and your current filter/date context.
Sources:
- https://learn.lexer.io/docs/event-explorer
- https://learn.lexer.io/docs/attribute-value-types
- https://learn.lexer.io/docs/commerce-data-specification
Reading Track Dashboards
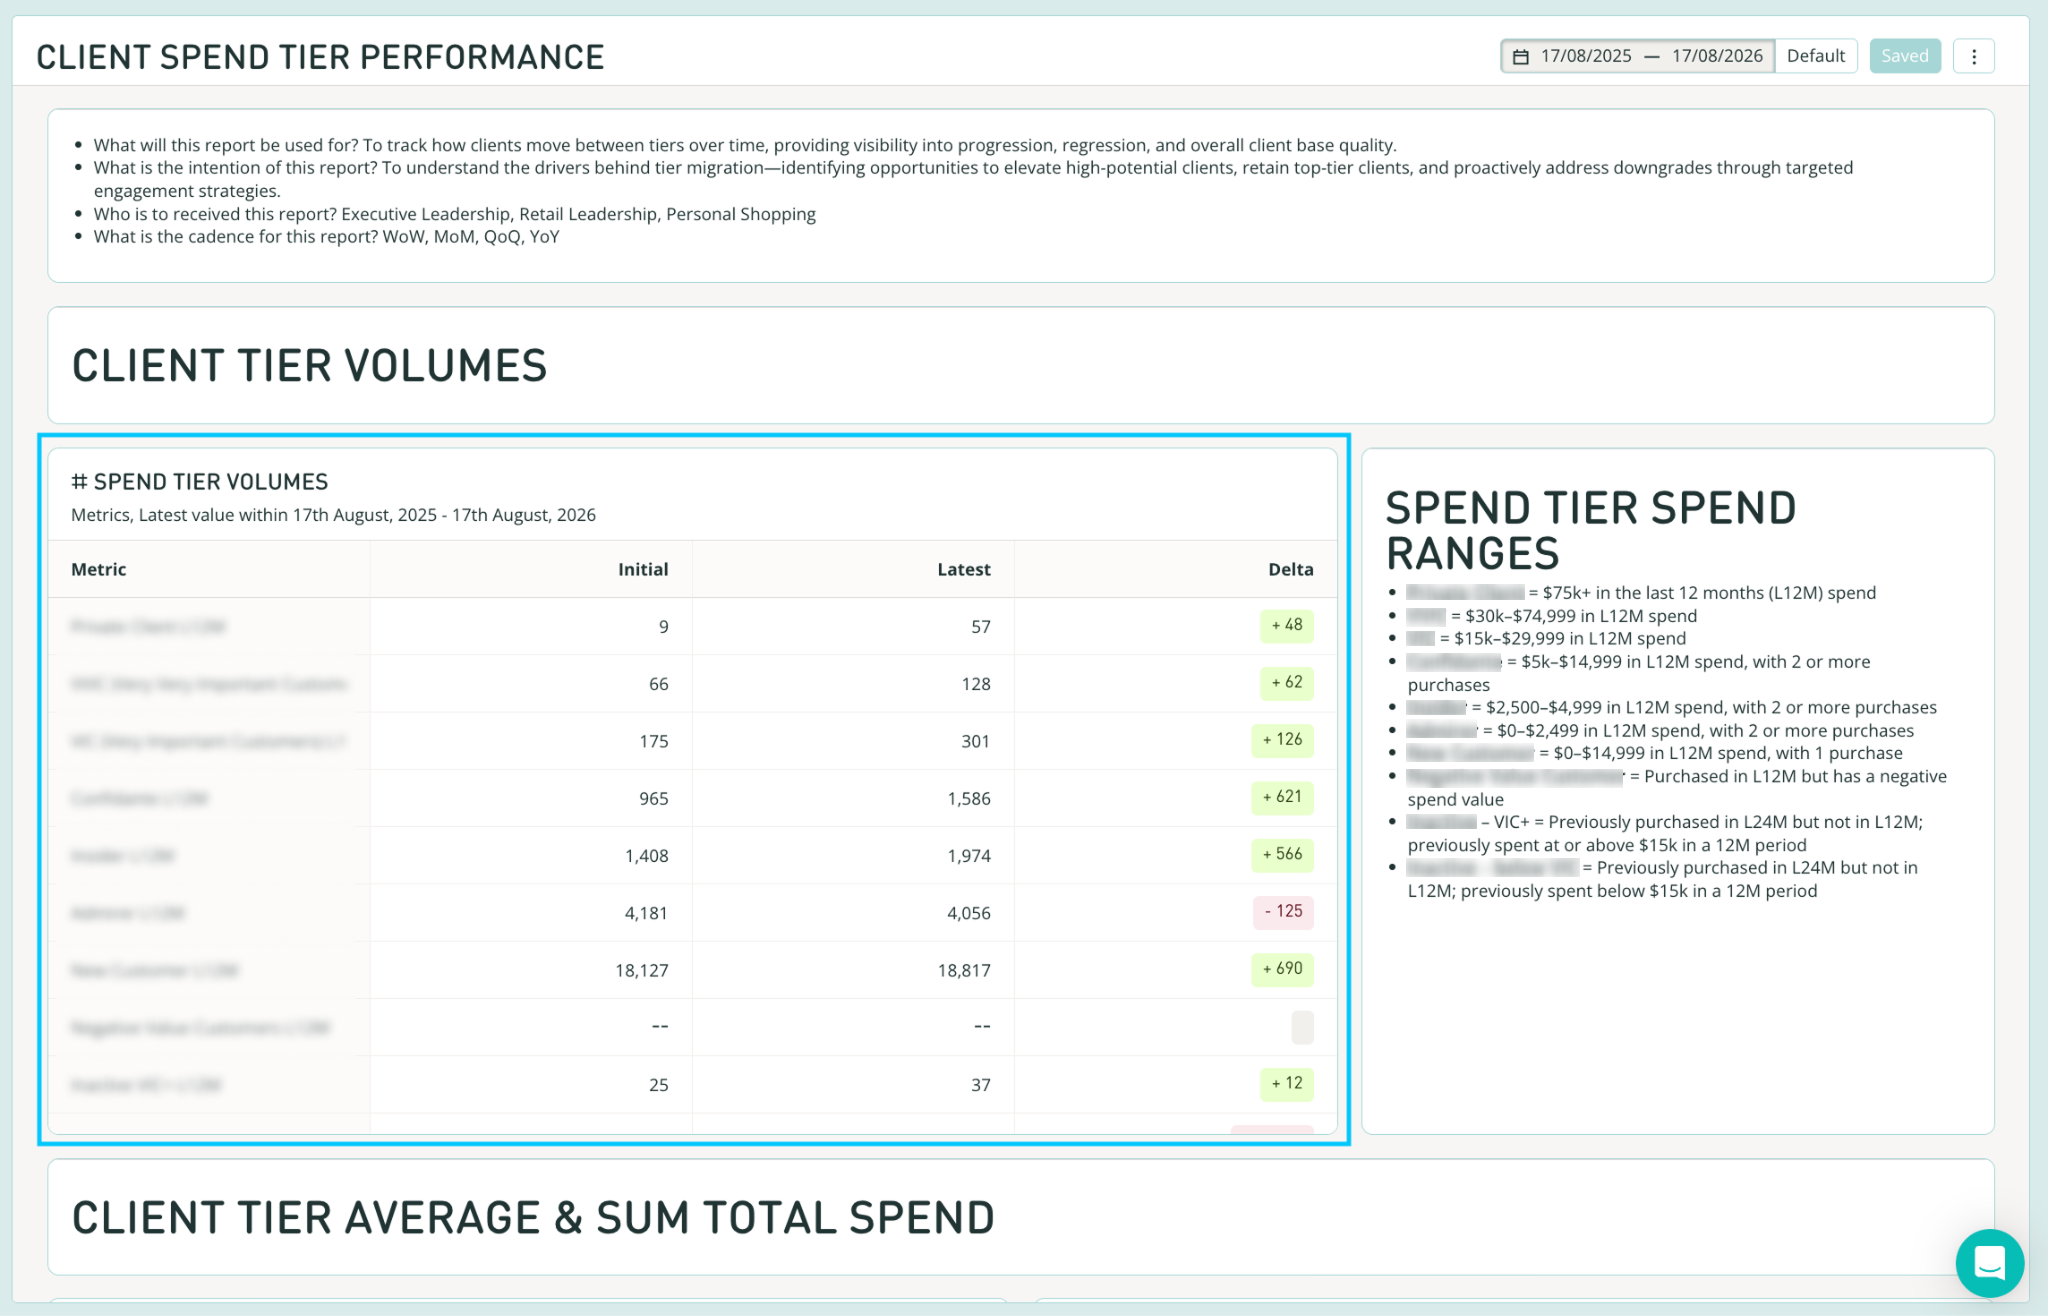
Track dashboards are created using a combination of segments built with Total Spend attributes AND saved tables from Event Explorer.
When interpreting the data, it’s important to consider which source you are working with, as these follow the same logic detailed above. Dashboards can have a mix of both sources.
Here is an example of a segment built metric:
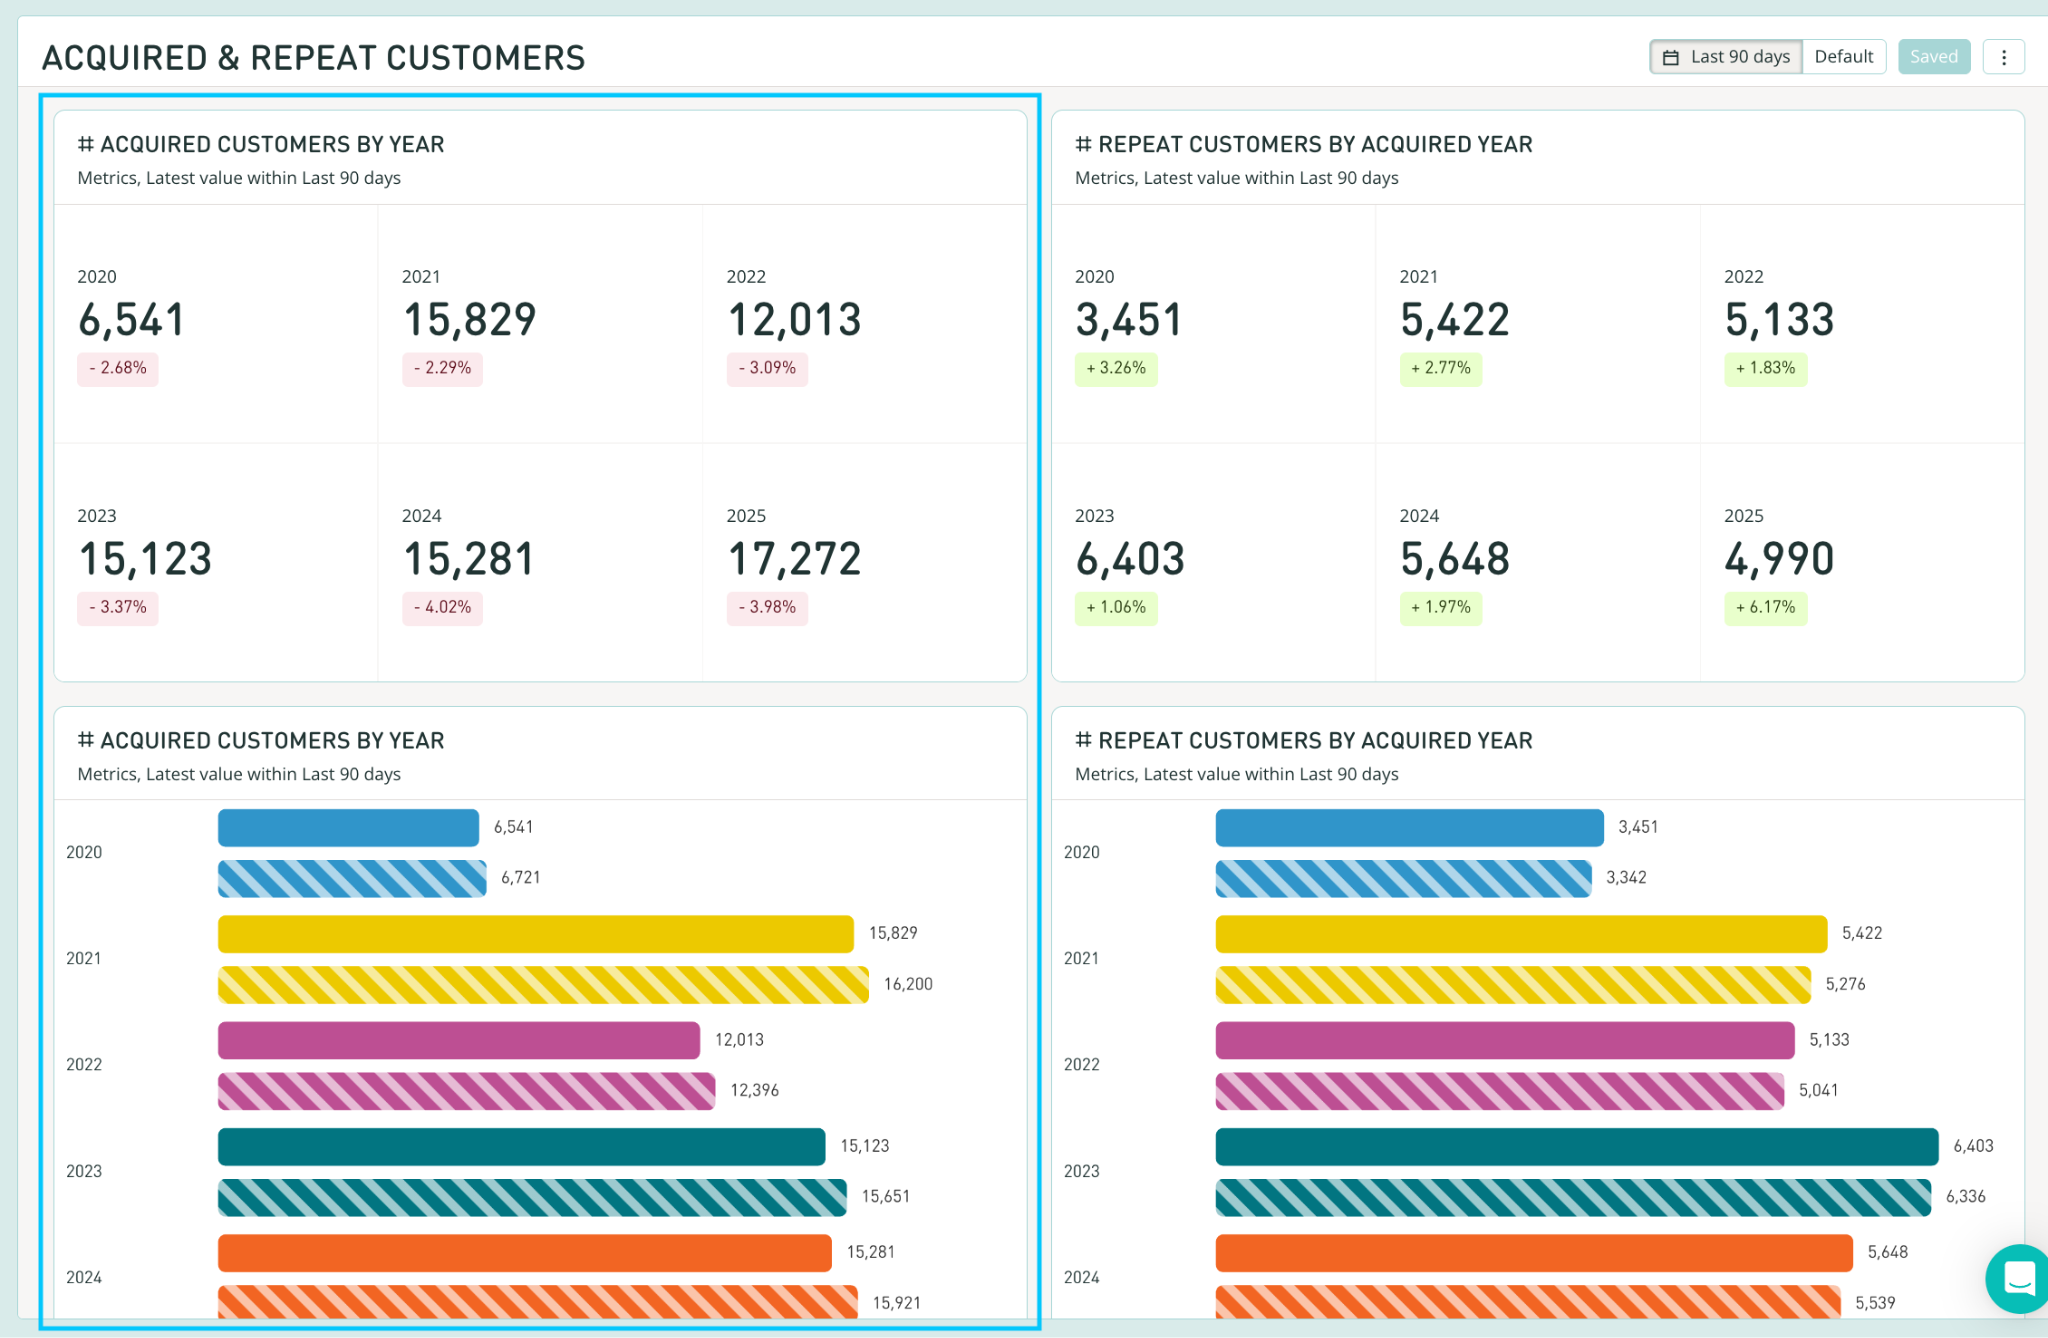
And here is an example of a saved Event Explorer table: